
Bitcoin rallied to a maximum in the third month of the third quarter. Following a correction of over 40% in Q2, many in the community now anticipate the king coin will soon breach its previous ATH. Those expectations were reinforced after BTC fluctuated just above the $ 50,000 level at press time after two weeks of steady consolidation. What’s more, it would now seem that on-chain indicators have finally aligned to pave the way north for premier cryptocurrency.
A recent report from Glassnode highlighted that with the price surpassing $ 50,000 and some notable profit taking last week, the market is currently at the upper end of a very high on-chain volume node.
Consider this – The chart attached herein highlights the price bands where the current BTC supply was last transacted. Since breaching last cycle’s $20k ATH, three distinct on-chain volume bands have formed.
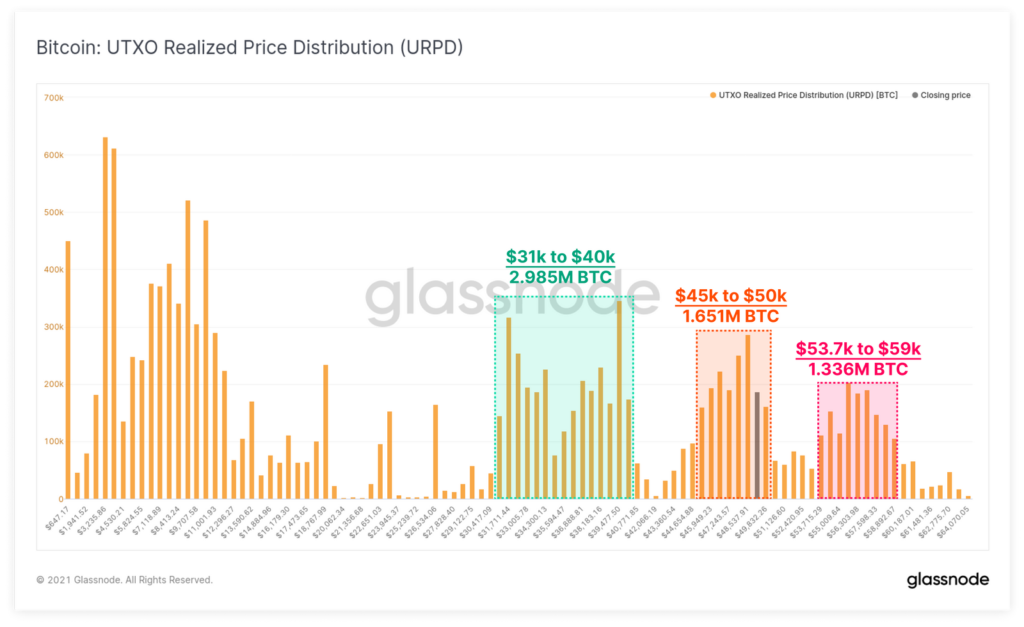
Looking at the position of the big picture of the Bitcoin market in terms of three distinct on-chain volume bands: $ 31k to $ 40k (minimum price), $ 45k to $ 50k (current range) and $ 53.7k to $ 59k (trillion) -dollar asset) – helps to understand the broader market sentiment. It indicated that a fairly strong set of high conviction investors remain in the market – A powerful signal for the bulls.
Bitcoin rally and aSOPR reset
Notably, profits continued to be made throughout August as the price traded higher. This presented an underlying market strength, capable of absorbing this spent coin supply.
Interestingly, the aSOPR metric highlighted that similar behavior was observed after the March 2020 sell-off. The event began with capitulation where losses were realized by panic sellers over an extended period of time. This was followed by returns in profitability as reported by trading aSOPR and holding above 1.0.
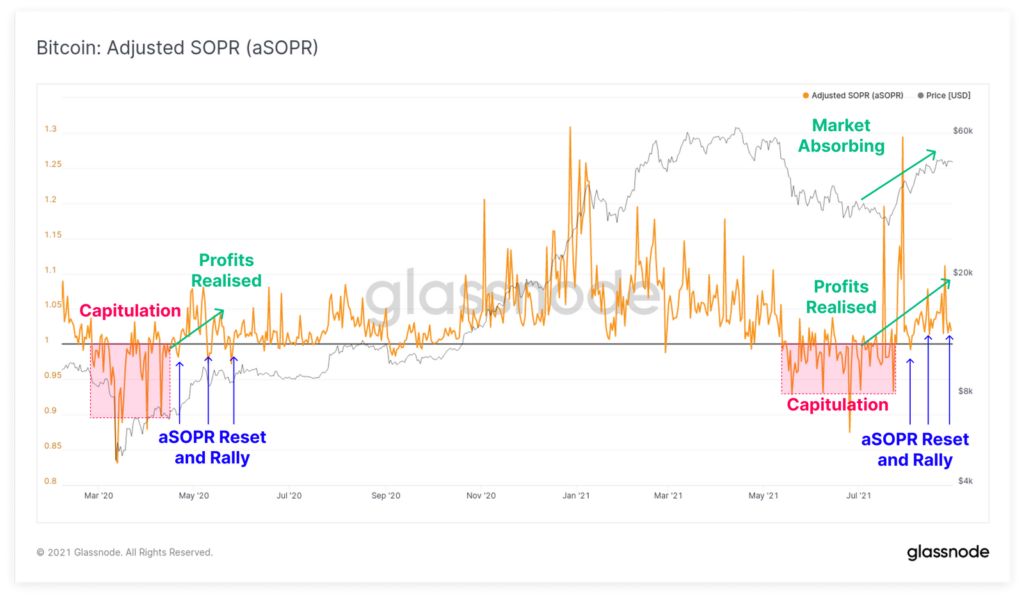
This suggested that while profits are being realized, the market strength is sufficient to absorb sell pressure.
Finally, buyer’s conviction returns when the aSOPR returned to 1.0 on several occasions. It then bounces higher, suggesting holders of profitable coins prefer to stay dormant and investors are buying the dip.
The calm before the storm
While the above metrics highlighted the start of a rally, with BTC’s price consolidating at the moment, some confusion loomed over the space.
However, the analysis of BTC’s average transactions per block showed a recovery in the on-chain movement. The yellow line signaled a more significant flow being moved over the last few days – A positive sign for expectations of an upside.
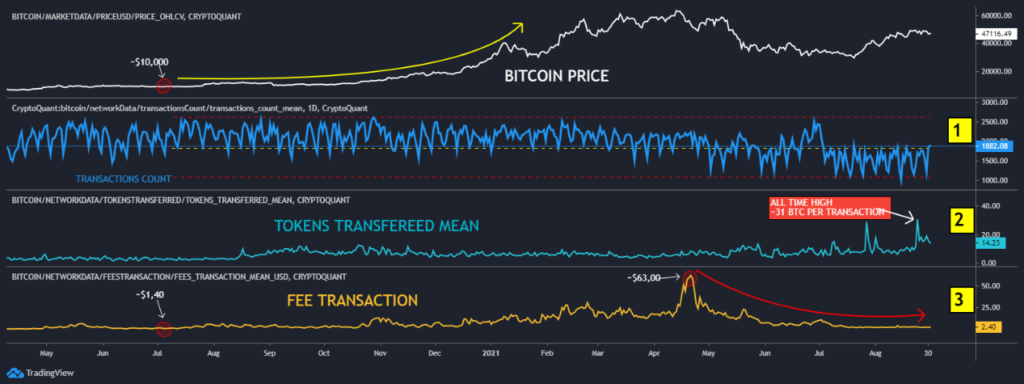
In fact, even a CryptoQuant analyst underlined that the average number of tokens transferred on the chain reached a new all-time high on the day that a large outflow of Bitcoin from Coinbase occurred.
31 BTC per transaction on average are transferred on the network. The average fee per transaction, however, was at a relatively low level, indicating a calmness before a price rise “storm” takes over.