ETH / USD – Ether drops below $ 3,000
Key levels of assistance: $ 2890, $ 2770, $ 2600.
Key Resistance Levels: $3000, $3180, $3200.
Ethereum fell 5% today as it fell back below $ 3,000 to hit the current support of $ 2,900. Since falling below the neckline on a head & shoulders pattern last Monday, the cryptocurrency has been trapped inside a trading range for the past eight days between $3180 and around $2770 (100-day MA).
The bulls rebounded from the lower end of the range on Sunday, but couldn’t overcome resistance at $ 3,180 yesterday. As a result, ETH fell back beneath $3000 again today.
The breakout of the current range will dictate the next direction of the market.
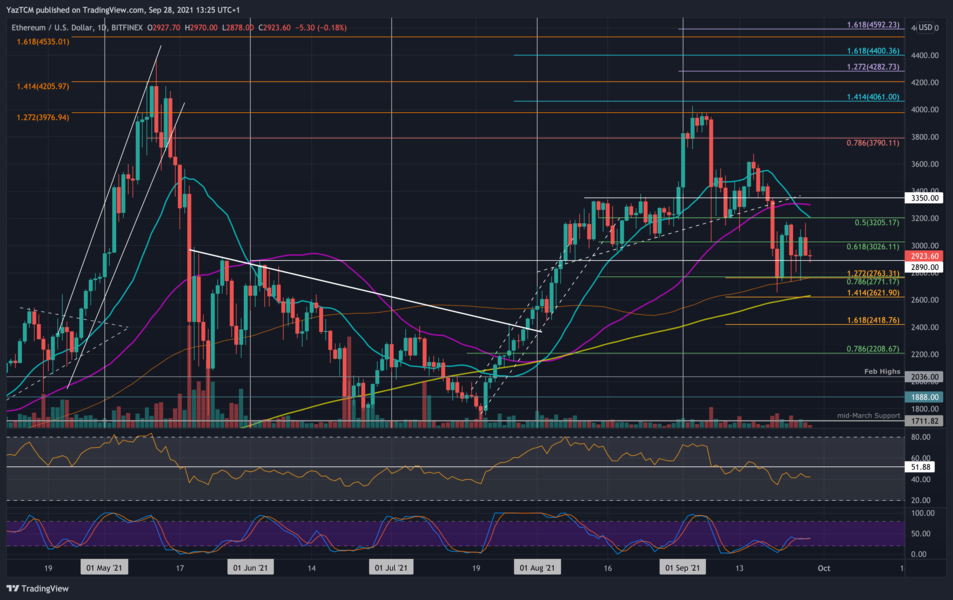
ETH-USD Short Term Price Prediction
Looking ahead, if the sellers push beneath $2890, the first support lies at $2770 (.786 Fib & 100-day MA). This is followed by $2600 (200-day MA) and $2500.
On the other side, the first resistance is at $ 3000. This is followed by $3180 (upper boundary of the current range), $3200 (20-day MA), $3300 (50-day MA), $3350, and $3500.
The daily RSI continues to sit below the midline indicating that sellers are in control of market dynamics.
ETH/BTC – ETH Holding Ascending Trend Line SUpport
Key Support Levels: 0.0691 BTC, 0.068 BTC, 0.0667 BTC.
Key resistance levels: 0.07 BTC, 0.0711 BTC, 0.072 BTC.
Against BTC, ETH is battling to hold the rising trend line that dates back to the end of July. The cryptocurrency has used this trendline as support over the past week and has struggled to break resistance at around 0.0711 BTC during the period.
On Sunday, ETH bounced higher from the ascending trend line to meet the resistance at 0.0711 BTC. Unfortunately, the buyers failed to break 0.0711 BTC and went from there yesterday to hit support at 0.0691 BTC today.
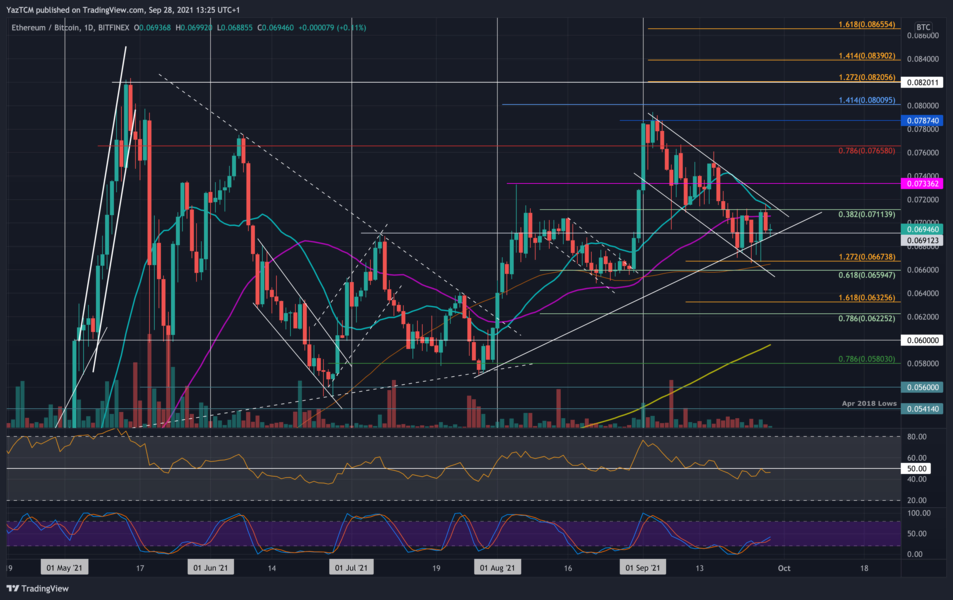
ETH-BTC Short Term Price Prediction
Moving forward, if the bears break beneath 0.0691 BTC, the first support lies at 0.068 BTC. This is followed by 0.0667 BTC (down 1.272 Fib Extension & 100 days MA), 0.066 BTC (0.618 Fib) and 0.065 BTC.
On the other side, the first resistance lies at 0.07 BTC. This is followed by 0.0711 BTC (20 day MA), 0.072 BTC, and 0.0733 BTC (August highs).
Again, the RSI is in bearish territory here as it sits beneath the midline.