In today’s chain analysis, BeInCrypto examines several fundamental metrics that highlight the health of the Bitcoin network: the hash rate and the mining difficulty ribbon.
In addition, the analysis points to the accelerating total transfer volume of BTC on-chain, which has reached a 5-year high. All of this against the backdrop of bullish Bitcoin price action, which is rebounding strongly and resuming its rally to a new all-time high.
Bitcoin resumes uptrend
Over the past two months, Bitcoin (BTC) has been consolidating in a range between the bottom at $40,596 and the peak at $52,708. Additionally, these areas are adjacent to the Fib retracement levels of 0.382 and 0.618 for the entire downward movement of the ATH to 64,895 reached on April 14, 2021 (yellow line).
The consolidation range was broken out on 6 October and at the press time BTC is approaching $56,000. Therefore, a break above the September 6 peak at $ 52,810 is a bullish signal that could lead to a continuation of the uptrend towards the new ATH. Currently, BTC is around 20% below this target.
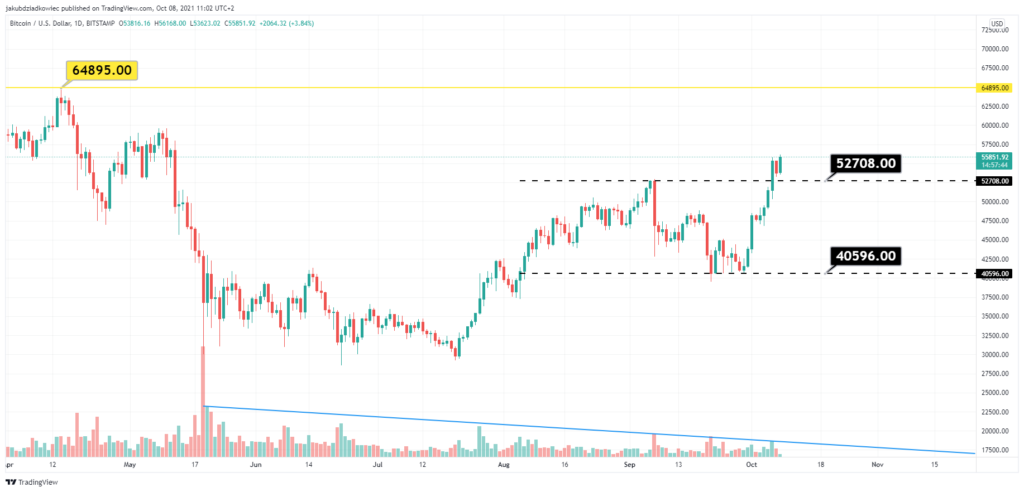
The breakout above the previous peak goes hand in hand with bullish readings of rising technical indicators. However, it is worth noting that the resumption of the uptrend is occurring with steadily declining trading volume (blue line), the local peak of which came at the May 19 crash and bottom at $30,000. This means that we can expect a large change in the price of BTC in the coming weeks or months.
Hash rate regains highs
The Bitcoin network’s hash rate is one of its fundamental parameters. It is a measure not only of the network’s speed and performance, but also of its security. The hash rate estimates the average number of hashes per second that all BTC miners produce.
Since the beginning of the Bitcoin network, we have seen a steadily increasing value of the hash rate, which however undergoes occasional corrections. These almost always correlate with BTC price corrections.
The largest ever decline in hash rate was recorded in the April-June 2021 period, when Bitcoin fell from ATH to bottom in the area at $30,000. On June 27, the hash rate was 61 million Th / s – the lowest level since mid-2019 (red circle). A key factor in this decline was the FUD around China’s BTC mining ban.
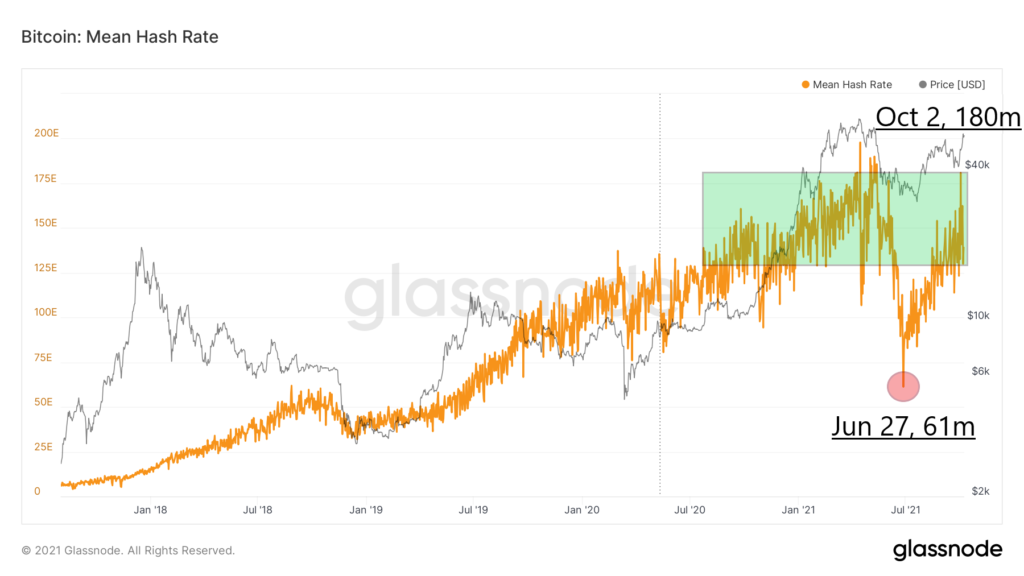
However, the BTC network has once again proven its robustness and the hash rate has been growing dynamically since then. In recent days, its value has returned to the peaks reached in late 2020 and early 2021 (green rectangle). On October 2, it hit 180 million Th / s, almost 3 times the June low.
Market analyst @caprioleio commented in a tweet on this rapid recovery of the Bitcoin network with the following words:
“A year ago, 60% of the network was in China. In May, the Bitcoin network had its legs and arms cut off. They completely regrew in just 6 months.”
“Great migration” of mining difficulty
The difficulty ribbon indicator uses multiple moving averages (MA) of the difficulty of BTC mining. Their compression has historically been a good signal for buying Bitcoin. The creator of the indicator is Willy Woo.
In the context of a bouncing hash rate, the on-chain analyst, @Negenttropic_ tweeted a board from the Difficulty Ribbon. He claims that the indicator “is soon to signal a positive recovery as more miners come back online”. He calls this process the “great migration”.
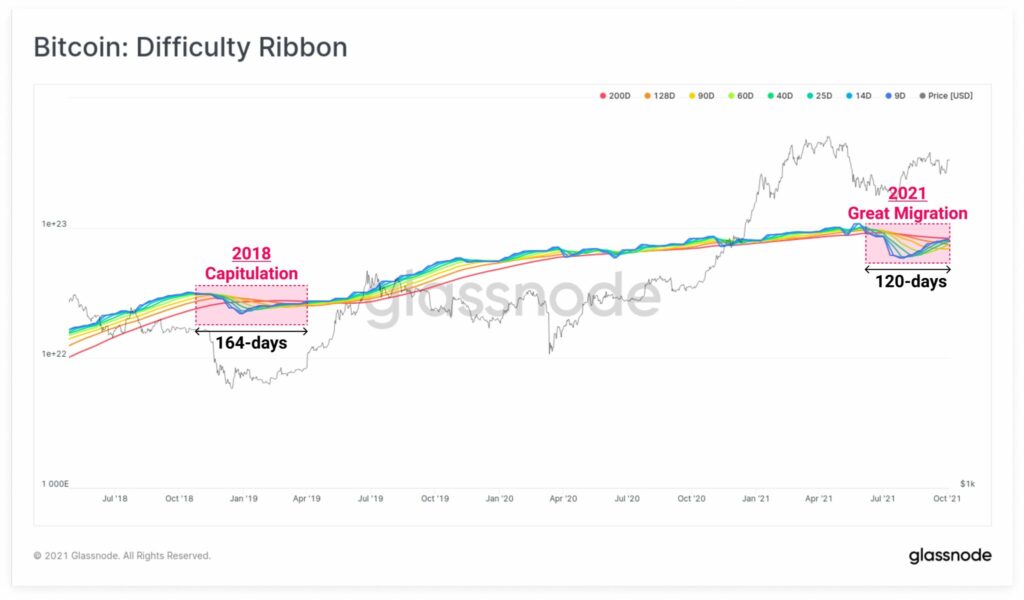
Further, the analyst adds that the drastic drop in the mining difficulty ribbon and hash rate of the Bitcoin network can be compared to a similar bear market event in 2018. Back then, a strong uptrend started after a positive signal from the ribbon indicator. It led BTC to a peak near $14,000 at the end of June 2019.
Save chain transfers
Another indicator looks interesting in view of the rise in the price of Bitcoin and the hash rate of the network. It is the Total Transfer Volume recorded by on-chain data. The indicator counts the total number of coins successfully transferred over the network.
It turns out that since mid-September, this indicator has recorded a 5-year peak (green area), and the average amount of BTC transferred is about twice as much as in the best periods of the previous cycle.
In addition, this happens with the decline in trading volume on the exchanges, as mentioned in the first section. Chain analyst @mskvsk pointed out in a recent Tweeter, commenting:
“Record amount of #Bitcoin have been moved last 2 weeks. Something’s brewing. Gun to head, ATH may happen sooner than we think.”