Ethereum (ETH) has been on the rise since September 21 but has yet to surpass its September high of $ 4,027. Despite this setback, it is showing many bullish signs that suggest it will return to its highs soon.
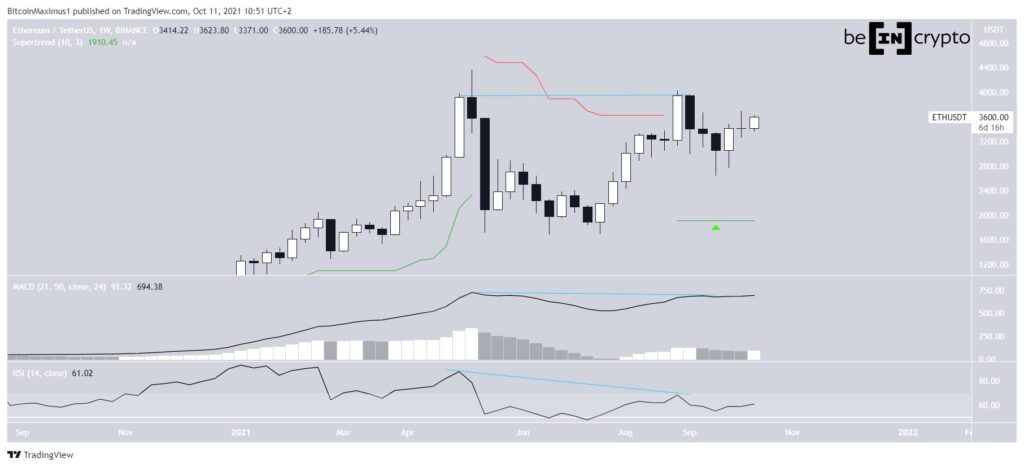
A look at the weekly Ethereum chart provides a mixed outlook.
During the period between May 10 and August 30, ETH created a double top pattern. This is often considered a bearish pattern that can lead to a trend reversal. The pattern was also combined with a bearish divergence in the RSI. RSI is an indicator of momentum and the fact that it peaked lower while price double-peaked is a sign that the increase in price is not associated with an increase in buying momentum.
However, ETH has moved above the Supertrend resistance line, which is now bullish (green icon). The Supertrend is an indicator created using the absolute highs and lows of the price movement, and determines whether the trend is bullish (green) or bearish (red).
As a result of the mixed readings, a look at lower time frames is required in order to better determine the direction of the trend.
Breakthrough in progress
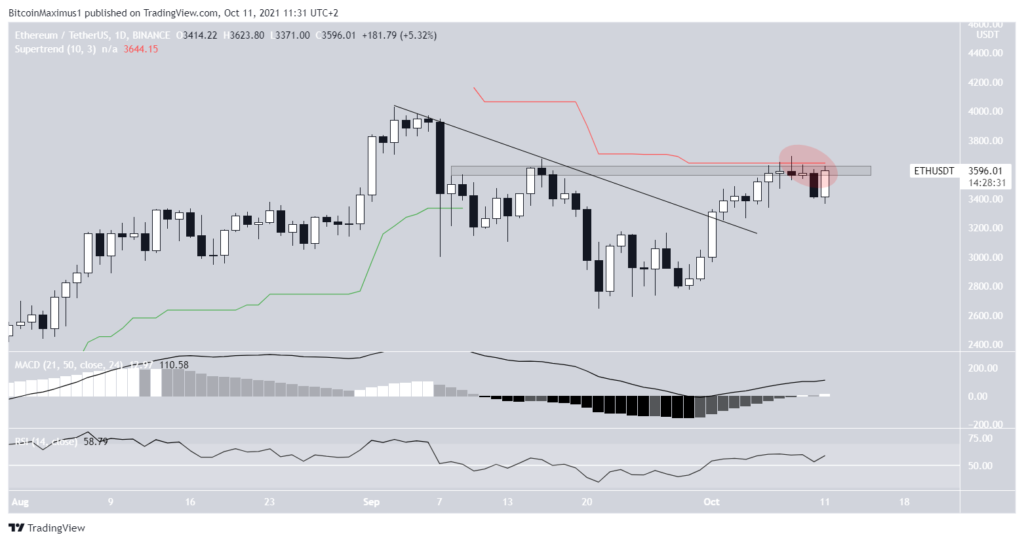
The daily chart shows ETH is currently breaking above $ 3,600, the last level of resistance before the September high of $ 4,027. The $3,600 area is both a horizontal resistance level and coincides with the Supertrend resistance line (red circle).
However, unlike the weekly calendar, the technical indicators on the daily chart are bullish.
The MACD, which is created by a combination of short and long-term moving averages (MA) is positive with an increasing histogram. This means that the short term trend is increasing at a faster rate than the long term trend.
The RSI has also moved above 50. The RSI is an indicator of momentum and movements above or below the 50 line can be seen as signs that the trend is bullish / bearish.
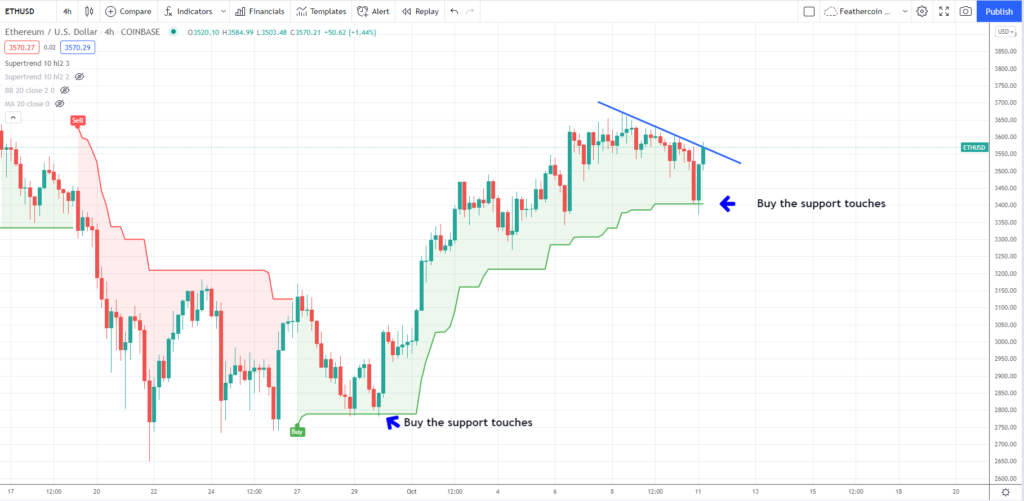
Cryptocurrency trader @IncomeSharks outlined an ETH chart, stating that the price has bounced at the Supertrend support line and is in the process of breaking out from a descending resistance line. Since then he has crossed the line and is trying to get past the $ 3,600 zone.
Therefore, the most likely scenario would indicate that a breakout will transpire.
Ethereum wave number
The wave count for Ethereum provides a bullish outlook, with the caveat of near-term uncertainty for its movement.
While it’s clear that ETH has completed a five-wave bullish impulse (highlighted in green), it’s not certain if the correction has come to an end.
The fact that an impulsive bullish move has ended means that the trend is bullish and the ensuing bearish move is just a correction in response to the bullish move.
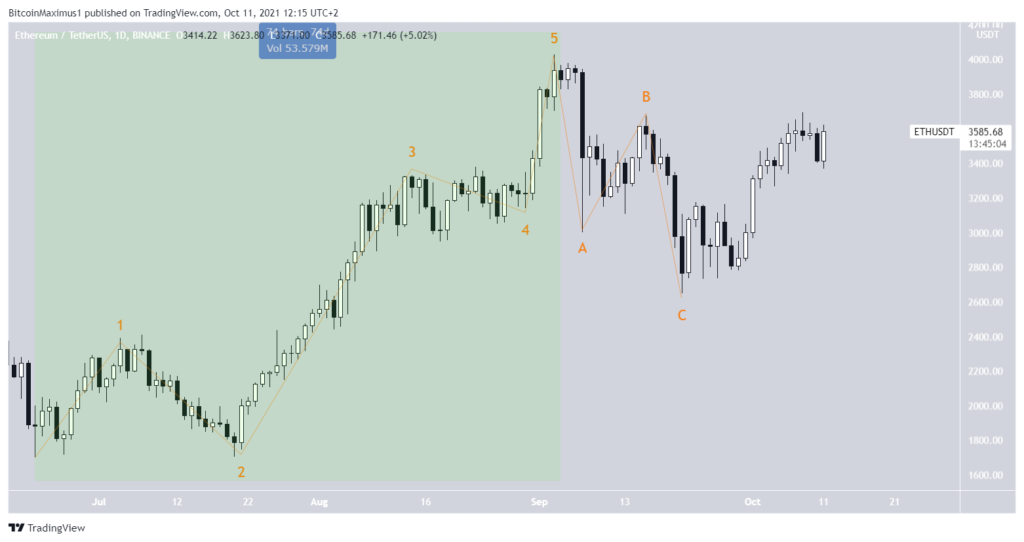
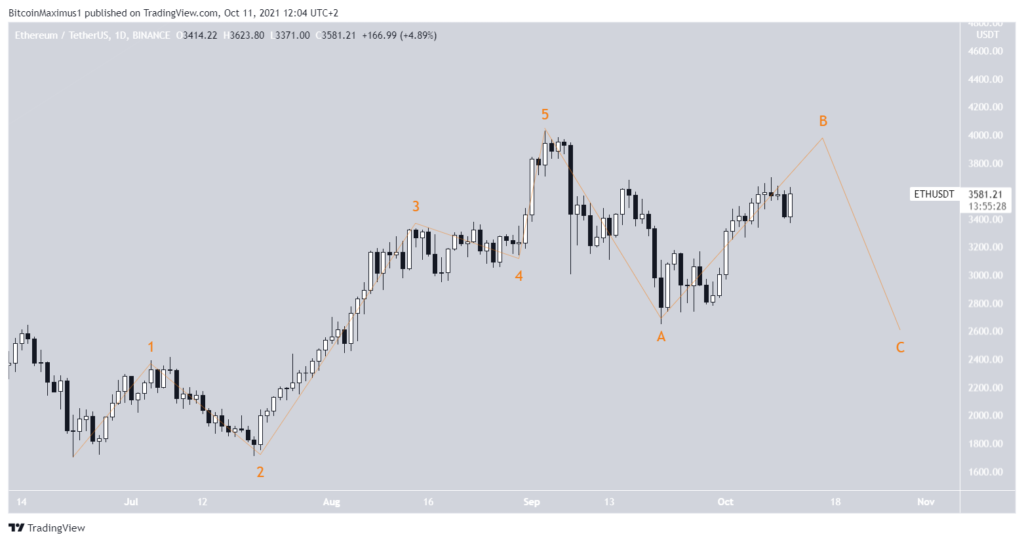
An alternate scenario suggests that ETH is still in the ‘B’ portion of its A-B-C corrective structure. After a further increase towards its September highs, it could potentially fall back to its September lows.
Nevertheless, the long-term movement would be unaffected by this, since another increase would be expected to follow.
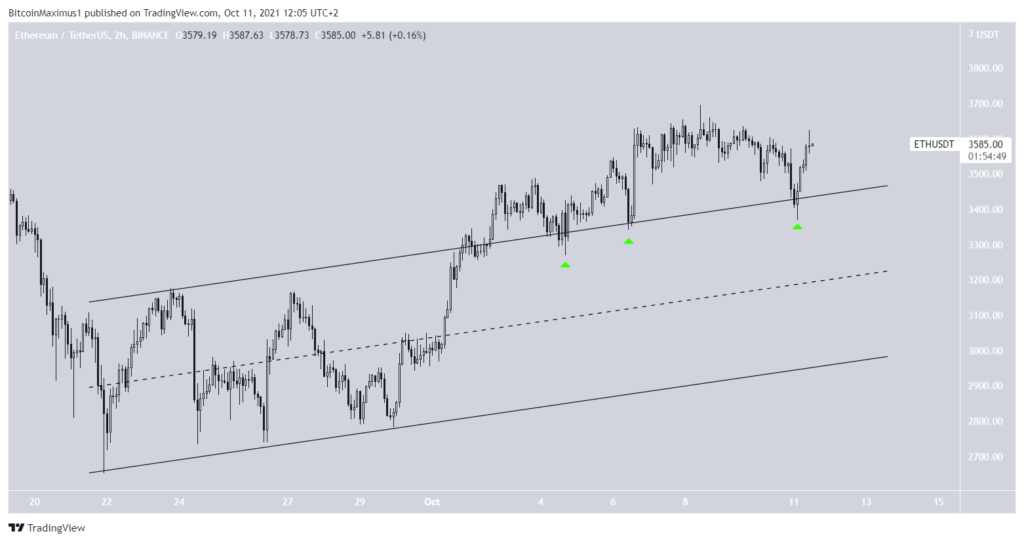
The two hour chart aligns more with the bullish scenario.
ETH has broken out from a short-term ascending parallel channel and validated it multiple times as support (green icons).
As long as it does not fall back inside the channel, the bullish scenario is most likely.
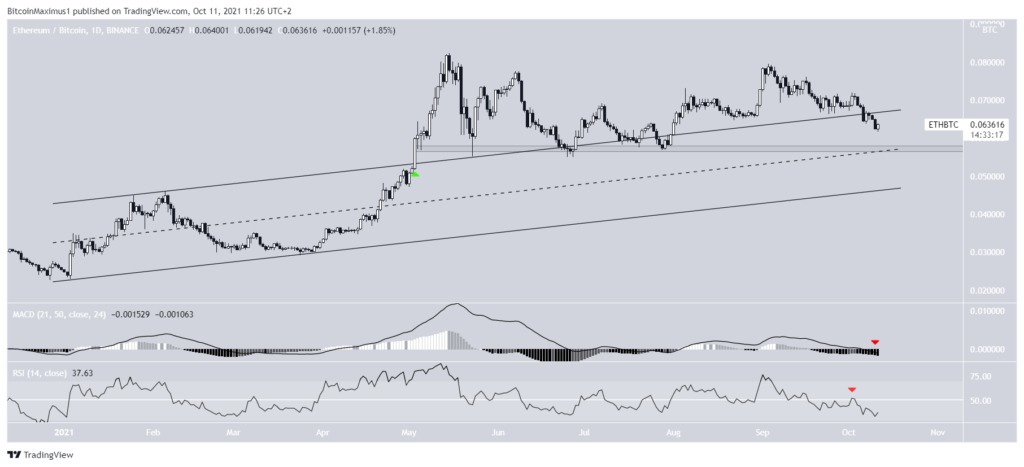
ETH/BTC
The ETH/BTC pair provides a bearish outlook. The first reason for this is the fact that ETH fell back inside the ascending parallel channel that persisted between January and April.
The breakout above the channel (green icon) signaled that ETH had begun an upward trend. However, it fell back inside the canal, indicating a correction.
The MACD and RSI both provide a bearish reading. The MACD is negative while the RSI is below 50.
The closest support area is found at ₿0.0575. This is a horizontal support area and coincides with the midline of the aforementioned channel.