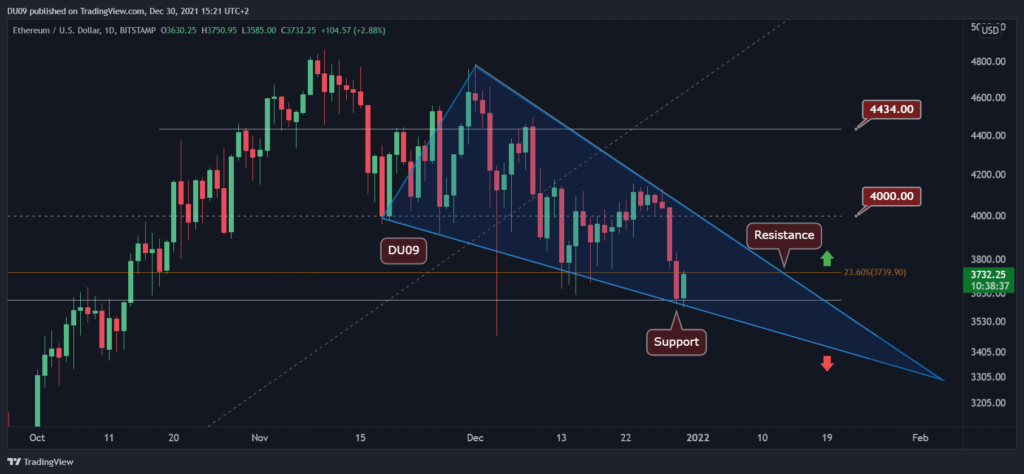
Key assistance levels: $ 3,600, $ 3,300
Key resistance levels: $ 3,740, $ 4,000
ETH has just made a lower low on the chart if we exclude the flash crash of December 4th. The price has reached the support level of $ 3,600 and is now just below the resistance of $ 3,740.
The current price action has also formed a large descending wedge (in blue). This is a bullish formation, but it can be quickly invalidated if ETH falls under the key support level.
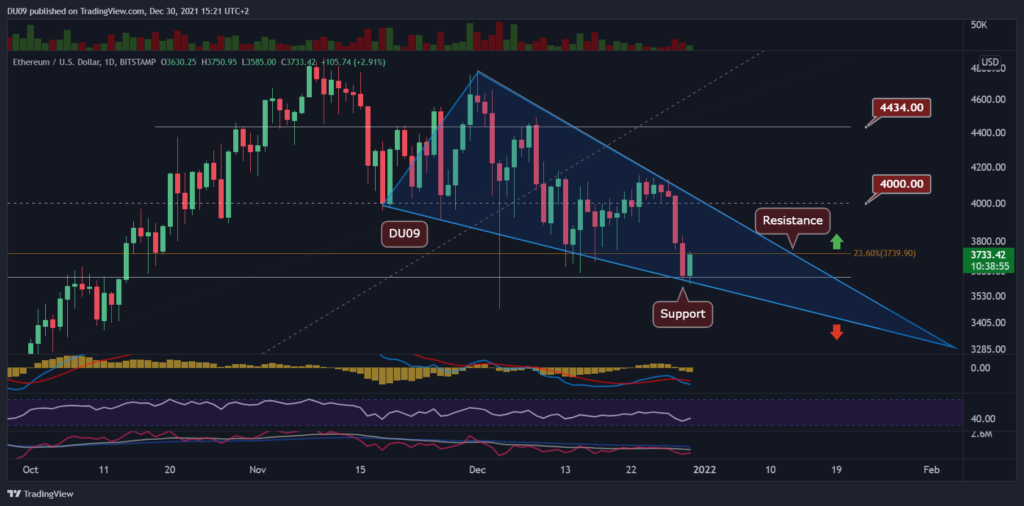
Technical indicators
Trade volume: The high volume during the sale is one of the reasons the price hit a low. The buying pressure now seems weak and should not exceed the current wedge (in blue).
RSI: The 4-hour RSI entered into oversold territory (<30), and the price has bounced from $3,600 as a result. On a daily timeframe, the RSI made a lower low. This is bearish.
MACD: MACD daily painted a bearish cross yesterday which is not good for the bulls. The only positive aspect is that the histogram has reached higher lows (bullish divergence) since November, when the correction began. This could indicate that this downtrend could end in January.
Bias
The bias for ETH is bearish. The bias will stay bearish as long as ETH fails to make a higher high.
Short term price prediction for ETH
The current price action looks quite interesting because if the bullish wedge is confirmed, then ETH should rebound sometimes in January, making this correction (November to January) quite similar to the one we had in May-July 2021. This scenario can be invalidated. as soon as the price closes a daily candle below the wedge.