
For Ethereum, the fundamentals remain positive even though the price has been strongly bearish. The on-chain data on Ether holders is encouraging and the Ethereum 2.0 upgrade is eagerly awaited.
On the charts, traders seem to view every higher timeframe bounce as a selling opportunity. Former support levels and demand zones have consistently been flipped to resistance and supply areas. This could see Ethereum head back towards the $2800-area.
However, if this area also fails to stop the bleeding, buyers would be in for a steep discount as Ethereum is likely to continue lower with $2,300 a possible target for the bears.
Ethereum – 12-hour chart
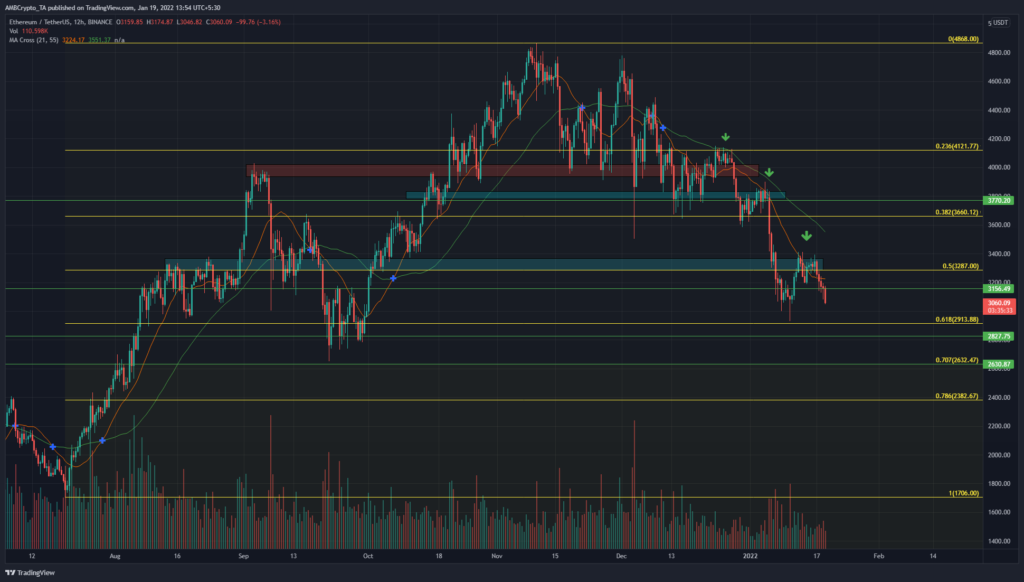
The $4000-area, the $3800-area, and more recently, the $3300-area have all been areas of demand in the run to $4800. However, the retracement from those highs has seen these areas flip from demand to supply, and have also been retested to give late longs a chance to close their positions. This also presented opportunities to open short positions on ETH.
The golden pocket refers to the 61.8% to 78.6% retracement area of the Fibonacci retracement levels (yellow). This pocket is usually a place where the pullback ends and the next run up (or down, depending on the previous trend) can be initiated.
The 70.7% retracement level coincided closely with a level of support at $2630.
For longer-term investors, this golden pocket may be an area where they can look to buy Ether. More risk averse investors can wait for the trend to reverse before entering the market.
Reasoning
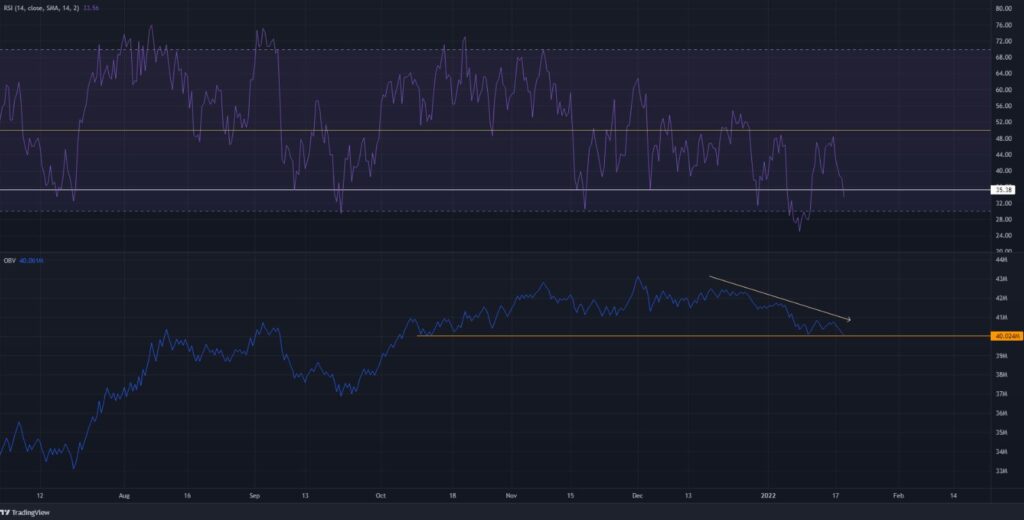
The RSI has been below the neutral 50 for many weeks now. On the 12-hour chart, the RSI attempted to climb above this level but was pushed back. At the time of writing, the RSI seemed to be heading below the 35 mark. In the past, such a sharp drop in the RSI has also been accompanied by a sharp drop in the price of ETH.
On the OBV, the orange level was one that ETH has stayed above since October when Ethereum was in the midst of its bull run and had climbed past the $3300 area. At the time of writing, the OBV was back at this level and could close a session below it. The trend on the OBV has been to the downside, alongside the price.
Conclusion
The indicators showed that strong bearish momentum and selling pressure were seen. Likely areas where ETH could next see a bullish reaction are the $2827, $2632, and $2382 levels.