
Ethereum’s price has been consolidating for quite some time as it followed Bitcoin’s lead. Unlike other altcoins, ETH’s volatility seems to be capped for now, with a high possibility of a resurgence as it forms a breakout pattern.
A comeback in the making
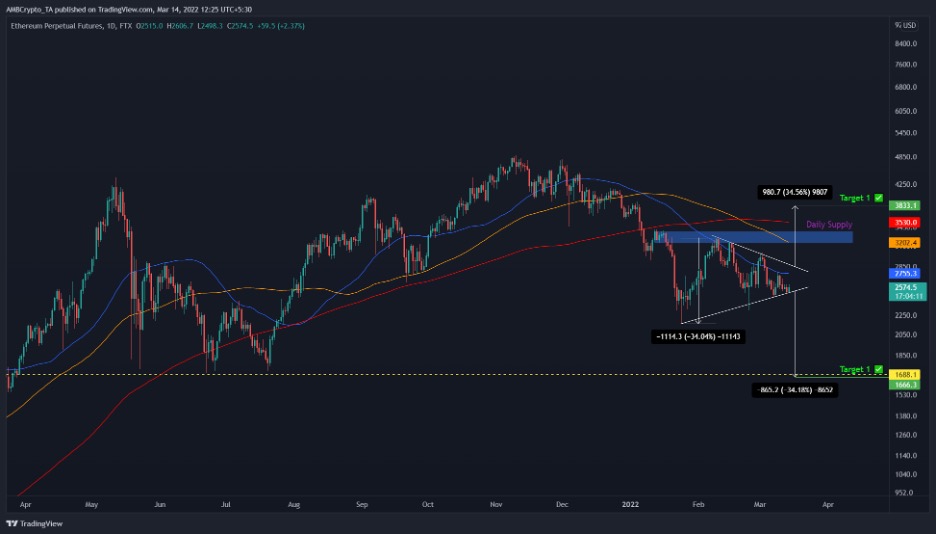
Ethereum’s price action over the past fifty days has formed a symmetrical triangle pattern. This pattern consists of three lower highs and four upper lows which are connected using trend lines.
The formation forecasts a 34% move, one determined by measuring the distance between the initial swing points of the triangle. Adding this distance to the breakout point reveals the target.
Assuming the price of Ethereum is bullish, the theoretical predictions place ETH at $3,833. On the contrary, a bearish outlook would indicate a crash to $1,688.
From a technical standpoint, the bullish outlook seems unlikely considering the plethora of hurdles present to the upside. The 50-day Simple Moving Average (SMA) is the first blockade, beyond which, the daily supply zone extending from $3,187 to $3,372 will prevent any bullish moves.
On the other hand, Ethereum price is more likely to break the lower trendline of the symmetrical triangle due to the uncertain nature of Bitcoin and lack of support levels. This outlook calls for a crash of 34% to $1,668.
Interestingly, this level coincides with the support level that extends all the way back to 28 March 2021.
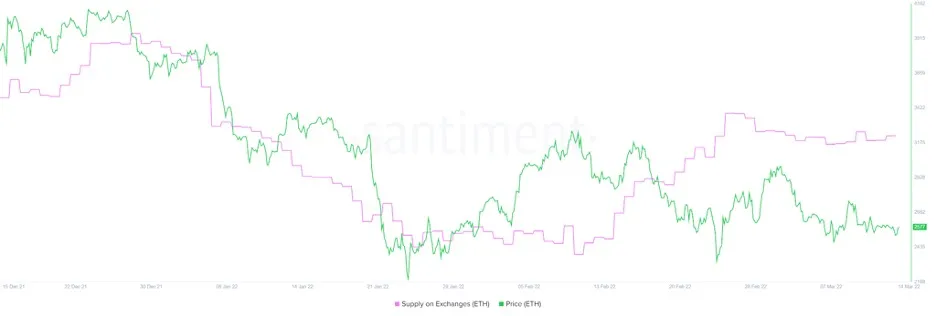
This bearish outlook is supported by the recent increase in ETH supply on exchanges. The total number of ETH present on the centralized entities indicates the intention of investors to sell when needed.
In case of a flash crash, the downswing will steepen if these holders panic sell their holdings. For now, the number of such tokens has increased from 15.53 million to 16.83 million – Net inflow of 1.3 million coins.
This 8.3% increase further confirms the bearish outlook obtained from a technical point of view.
While the scenarios are looking grim for Ethereum’s price, a bullish move, one that pierces the 200-day SMA at $3,530 will create a relatively higher high and invalidate the bullish thesis. In such a case, investors can expect ETH to make a run towards the target of $3,833, completing the 34% ascent.
In some cases, the rally may extend to the psychological barrier of $4,000. Here, ETH may be likely to establish a local top.