On April 18, Bitcoin (BTC) fell below $40,000 for the first time this month. Short-term indicators are showing extremely oversold readings, suggesting that a significant rebound is near.
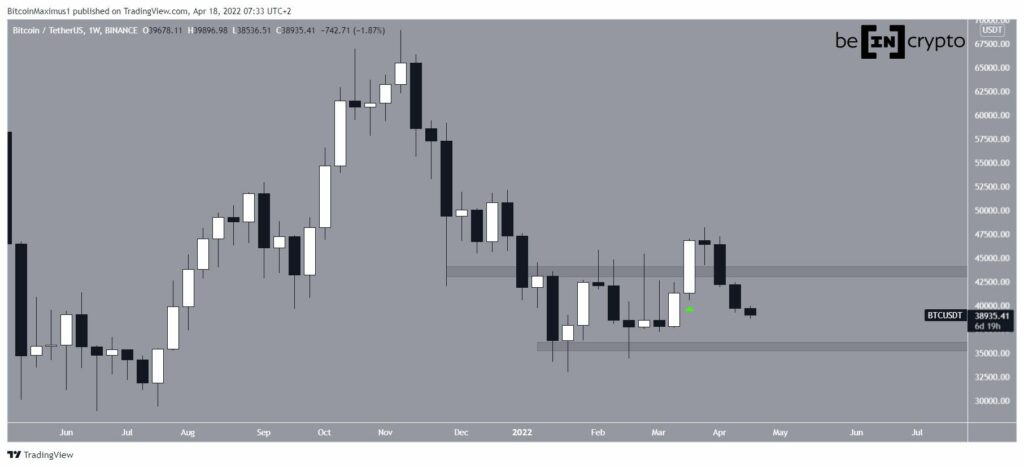
This effectively reversed all the increases Bitcoin enjoyed during the week of March 21-28 (green icon). On top of that, it caused a decisive close below $43,600, a level that was expected to act as support. Now he is likely to act against the resistance again.
The next closest support in the weekly time frame area is found near the January wick lows at $35,700.
Mixed readings
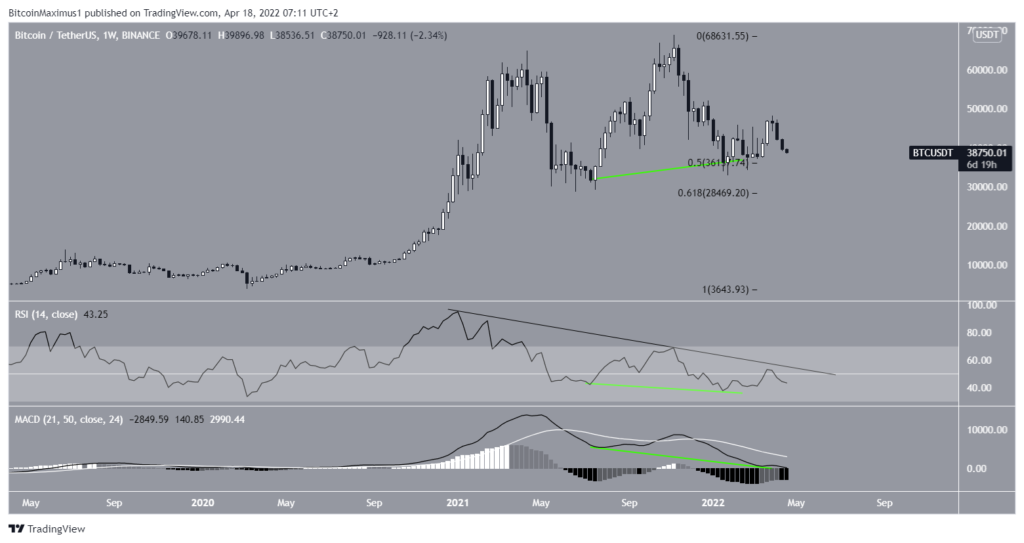
Technical indicators on the weekly horizon are mixed.
The MACD and RSI are both falling, and their bearish trendlines (black lines) are still intact. On the other hand, there are hidden bullish divergences (green lines) that have developed in both indicators.
Although the price action appears bearish, BTC is still trading above the 0.5 Fib retracement support level of $36,100.
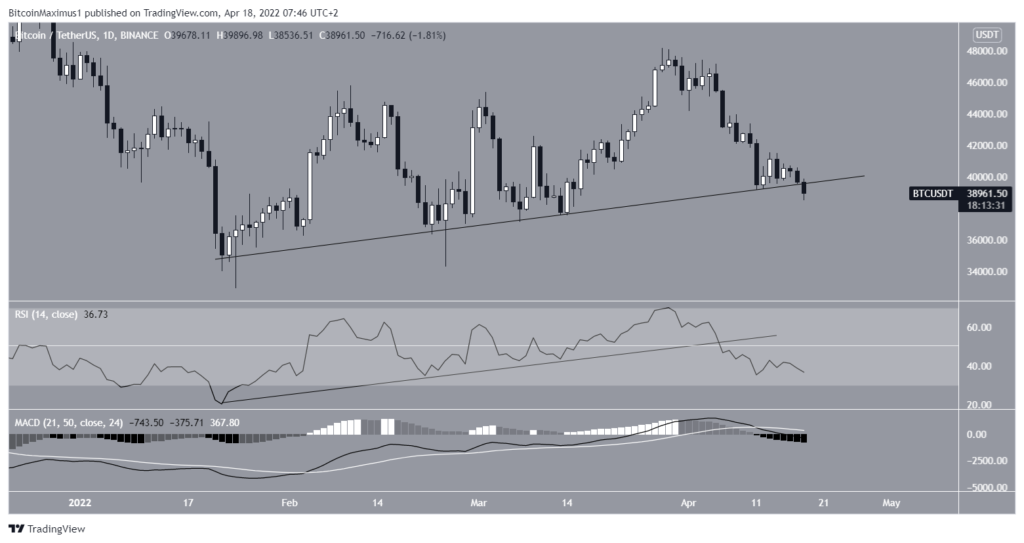
The outlook from the daily time frame is more decisively bearish. The RSI has broken down from an ascending support line and is now below 50. The MACD is also decreasing and is in negative territory.
On top of that, BTC fell below an ascending support line that had been in place since January 14, but it has yet to hit a daily close below that line.
Future BTC movement
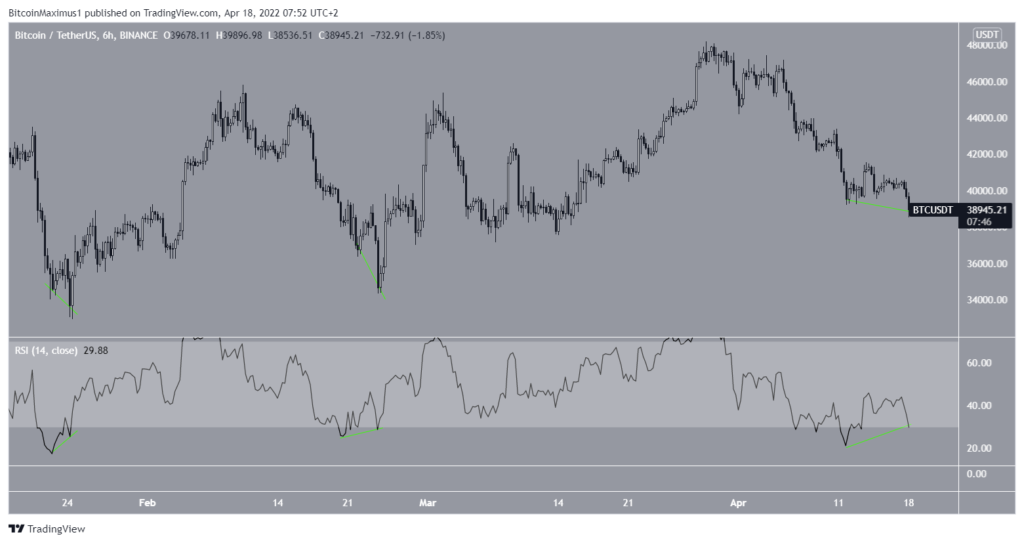
Despite the bearishness from the weekly and daily time frames, short-term signals indicate that a bottom is relatively close.
The reason for this is the bullish divergence of the oversold 6-hour RSI. The previous two times this happened (green lines), major upward price moves followed.
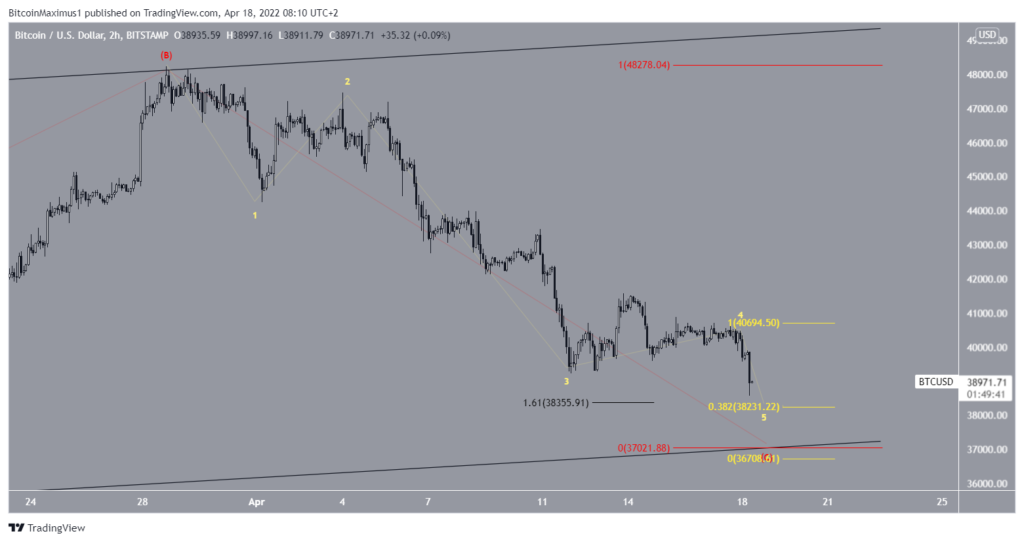
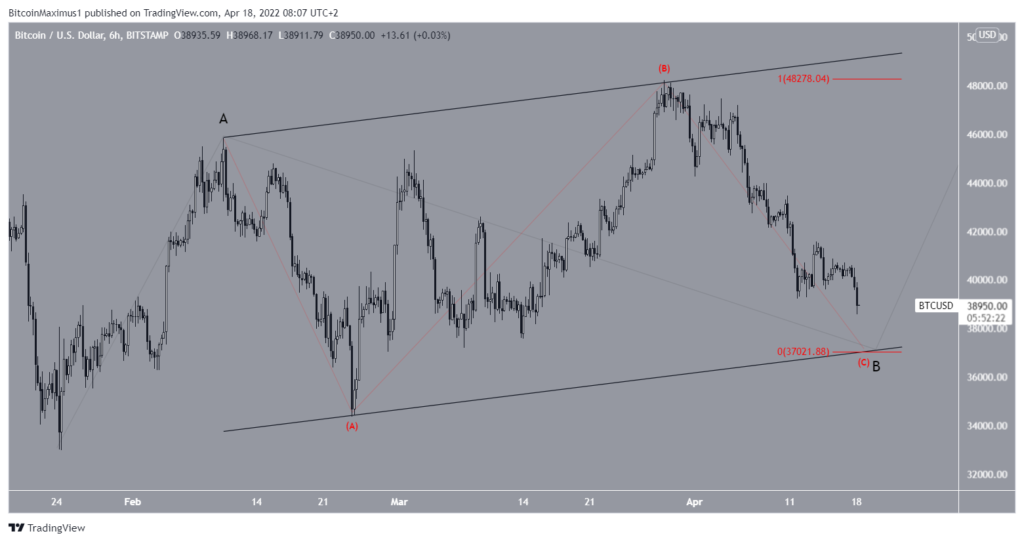
The wave count suggests that BTC is completing an A-B-C corrective structure (red), which could lead to a low of $37,000. This would give waves A and C a 1:1 ratio. This would also allow BTC to retest the support line of a large ascending parallel channel.
The short-term wave count suggests that BTC is in the fifth and final wave and suggests a main target of $38,200 to reach a bottom. This is found using the outer 1.61 Fib retracement of wave four (black) and the length of wave one (yellow).
The long-term wave count suggests that an eventual move above $50,000 would be likely to follow.