Bitcoin (BTC) is showing strong signs of a bullish trend reversal after increasing considerably on April 18.
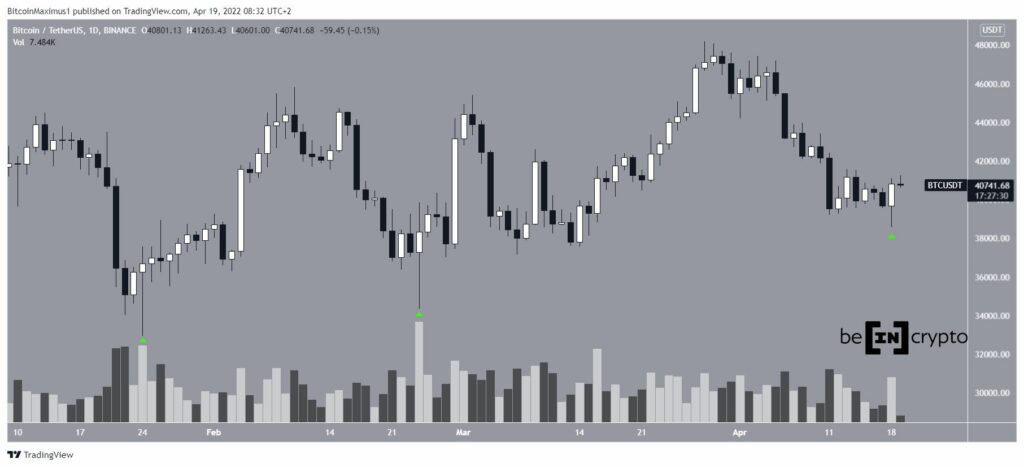
On April 18, Bitcoin reached a local low of $38,536 but rebounded and created a bullish engulfing candlestick. This is a candlestick pattern in which all of the previous day’s decline is undone in the next day’s move. In addition to this, the pattern had a long lower wick, which is considered a sign of buying pressure.
When comparing it to the previous price movement, the pattern is very similar to the candlesticks of Jan. 24 and Feb. 24 (green icons). In both instances, significant price increases followed. All three were also combined with higher than average volume.
Short-term BTC bounce
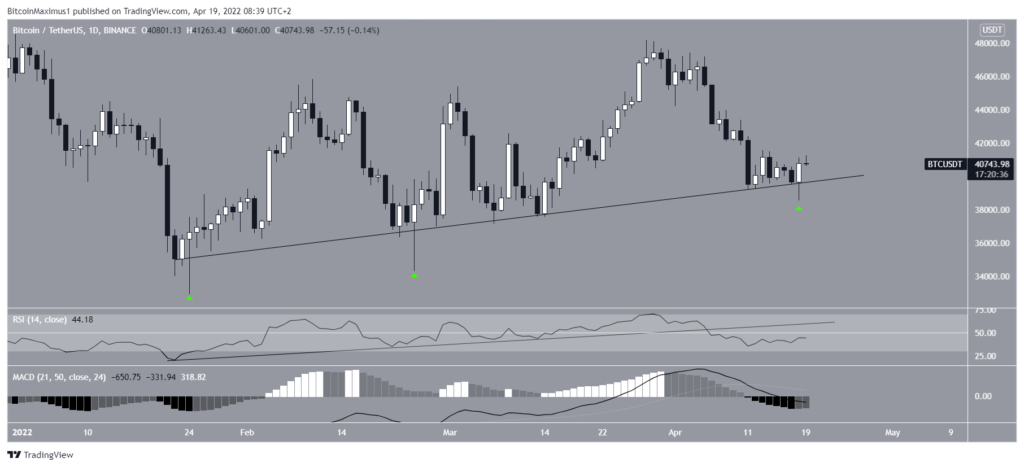
A closer look at the daily chart shows that the price has been moving above an ascending support line since January 24th. The line has been validated several times so far. The aforementioned wick downs initially brought BTC below the line, but it was recovered soon after.
Despite this seemingly bullish price action, technical indicators are decisively bearish. The RSI has been decreasing since April 2, broke down from an ascending support line, and is below 50.
Likewise, the MACD is down and is in negative territory. These are both considered signs of a downtrend.
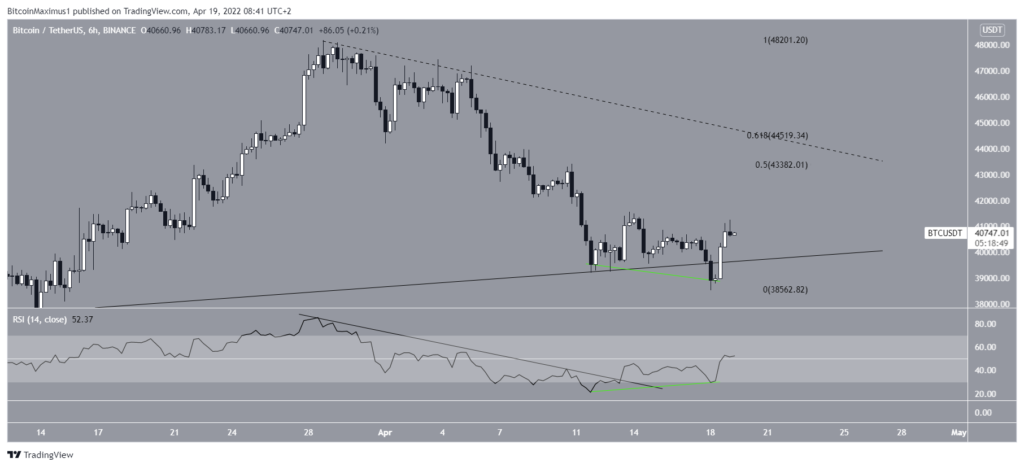
The six-hour chart on the other hand is a bit more bullish.
The main reason for this is that the RSI broke out of a descending resistance line and generated a bullish divergence after (green line).
If the ongoing rebound in price continues, the closest resistance would likely be reached between $43,480 and $44,510. This area is created by the 0.5-0.618 fib retracement resistance levels and also coincides with a descending resistance line (dashed) that’s been in place since March 28.
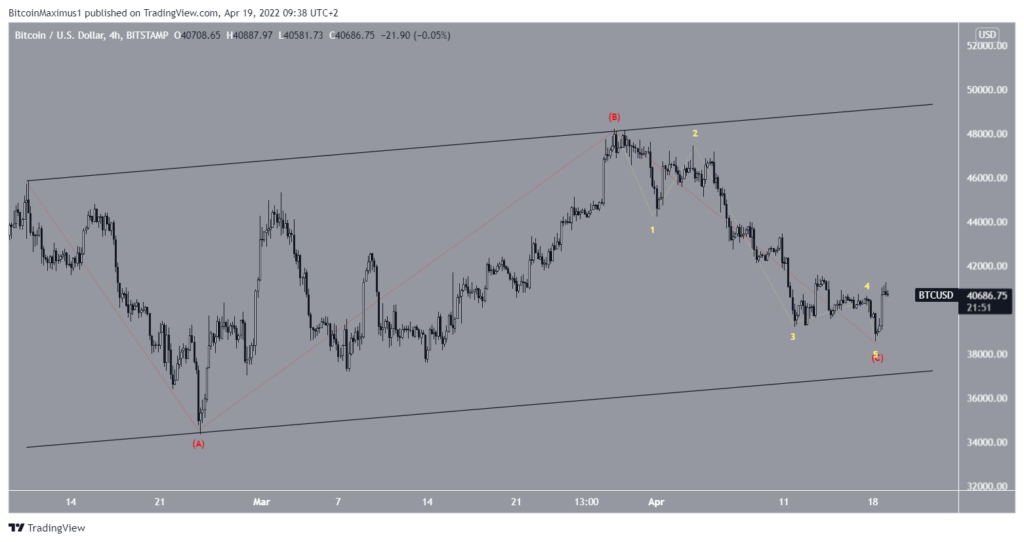
Wave count analysis
The wave count suggests that BTC is nearing the bottom of what is likely a C wave (red). The sub-wave count is shown in yellow.
A rough target for the bottom of this move is between $37,000 and $37,250. This would give waves A and C a 1:1 ratio, and is a projection of the length of subwave one (yellow).
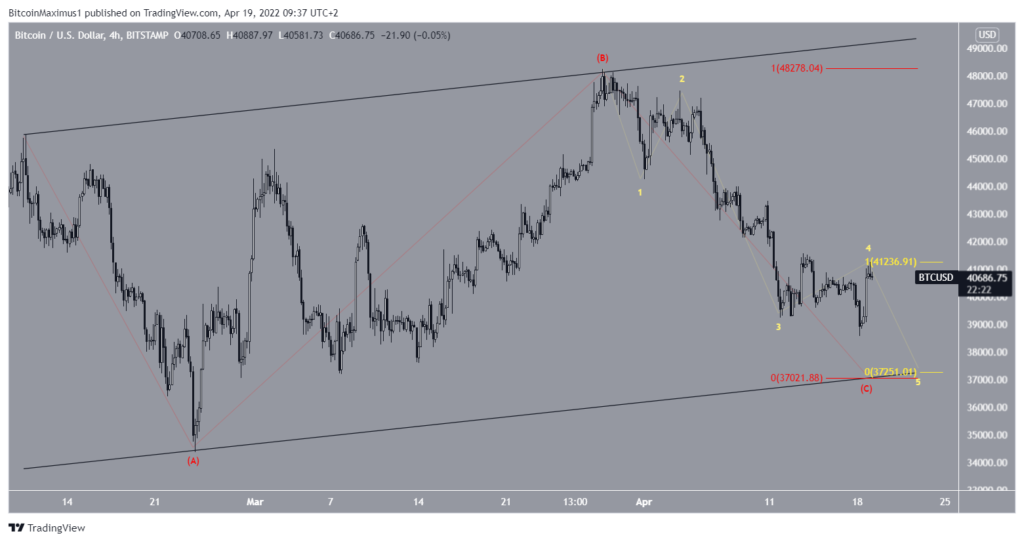
The alternate count suggests that wave C is already complete. However, due to the fact that there are no proportions between the waves, it’s less likely to transpire.
Either way, the bottom appears to be near and the long-term wave count suggests that an eventual move above $50,000 would likely follow.