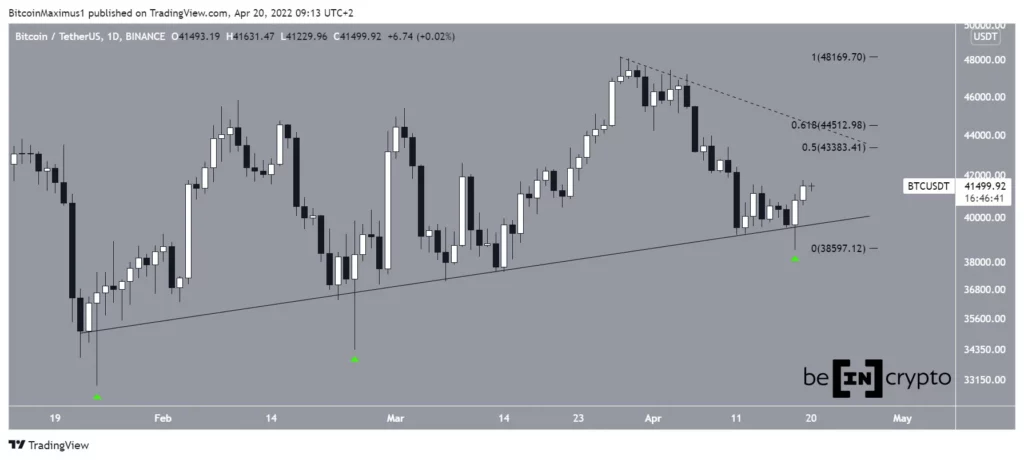
Bitcoin (BTC) increased considerably on April 18 and 19, suggesting that the correction that’s been ongoing since the beginning of the month might have come to an end.
After creating a bullish engulfing candlestick on April 18 (green icon), Bitcoin resumed its upward move the following day, leading to a high of $41,760.
The first part of the increase is similar to that which transpired on Jan. 24 and Feb 24 (green icons), when BTC created a very similar candlestick in the daily time frame.
If the upward move continues, the nearest resistance zone would be seen between $43,380 and $44,510. This resistance is created by the 0.5-0.618 Fib retracement resistance levels and coincides with a descending resistance line (dotted).
Mixed readings
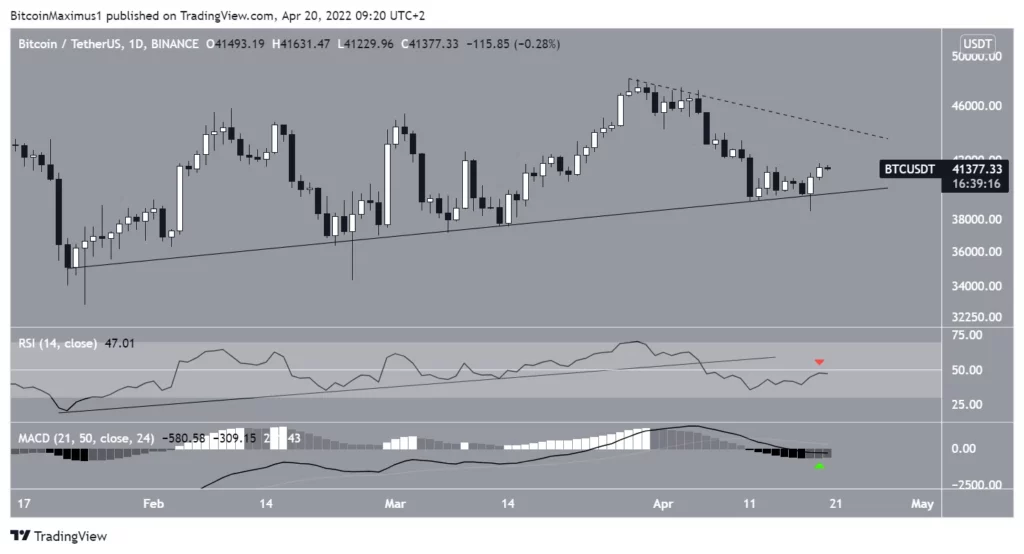
Technical indicator readings in the daily and six-hour charts provide conflicting readings for BTC.
The daily RSI is decidedly bearish. It broke down from a long-term ascending support line and was rejected by the 50 line (red icon). These are both considered signs of a downtrend.
The daily MACD is mostly bearish since it’s decreasing and is negative. However, it’s showing signs of strength by creating successive higher momentum bars (green icon).
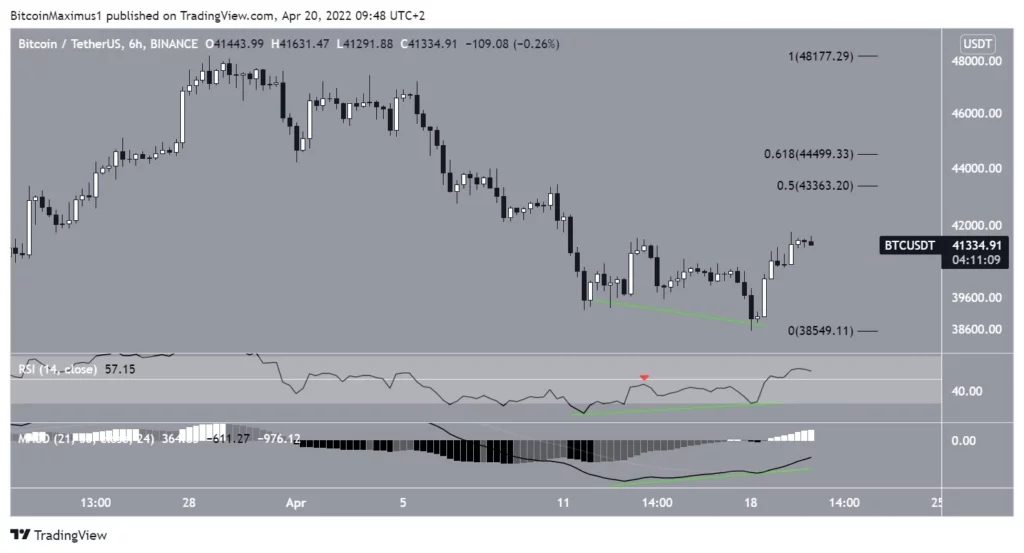
On the other hand, the six-hour chart is more definitely bullish. It shows bullish divergences in the RSI and MACD.
The movement above the high between the divergences (red icon) also completed a failure swing top pattern. This confirms the bullish divergences and suggests that an upward move towards the 0.5-0.618 Fib retracement resistance area is likely.
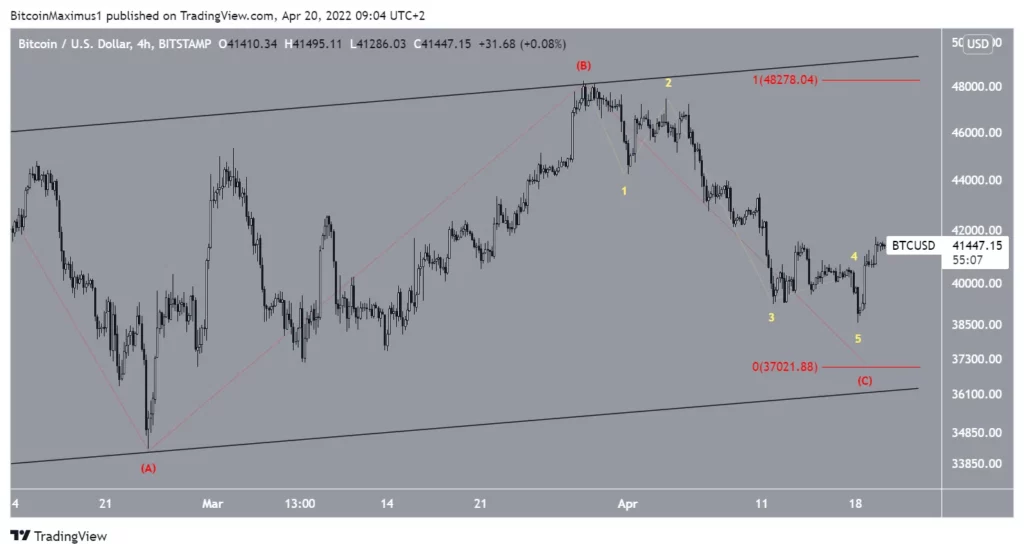
BTC Wavenumber Analysis
There are two potential wave counts still in play, both indicating that BTC is moving into a corrective ABC (red) structure.
The first count suggests that BTC is at the top of sub-wave four (yellow). In it, the price will likely decrease toward $37,000, giving waves A and C a 1:1 ratio.
The long-term wave number is also bullish and supports the continuation of the uptrend.
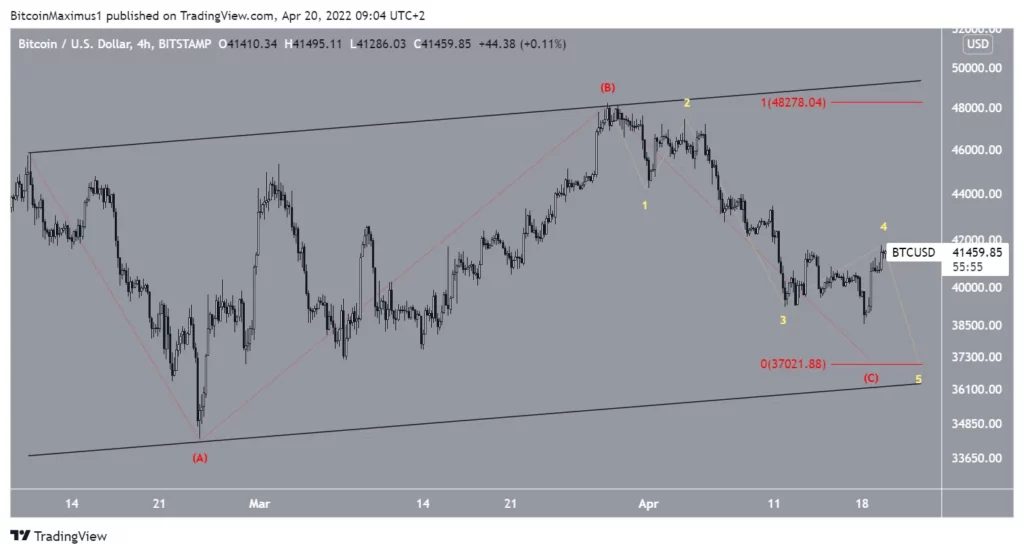
The second possibility suggests that BTC has already completed the entire five-wave downward correction. While this is still a legitimate possibility, the ratios do not fit as well as the previous count.
Specifically, waves A and C have a ratio of less than 1:1, and subwave five is tiny compared to the other subwaves.
Therefore, based on the wave count alone, the first scenario is more likely to play out.