Willy Woo is one of the pioneers of on-chain analysis and creating Bitcoin indicators based on direct data from the blockchain. In a recent tweet, while analyzing the BTC supply shock indicator, he stated that “the orange coin seems a bit undervalued.”
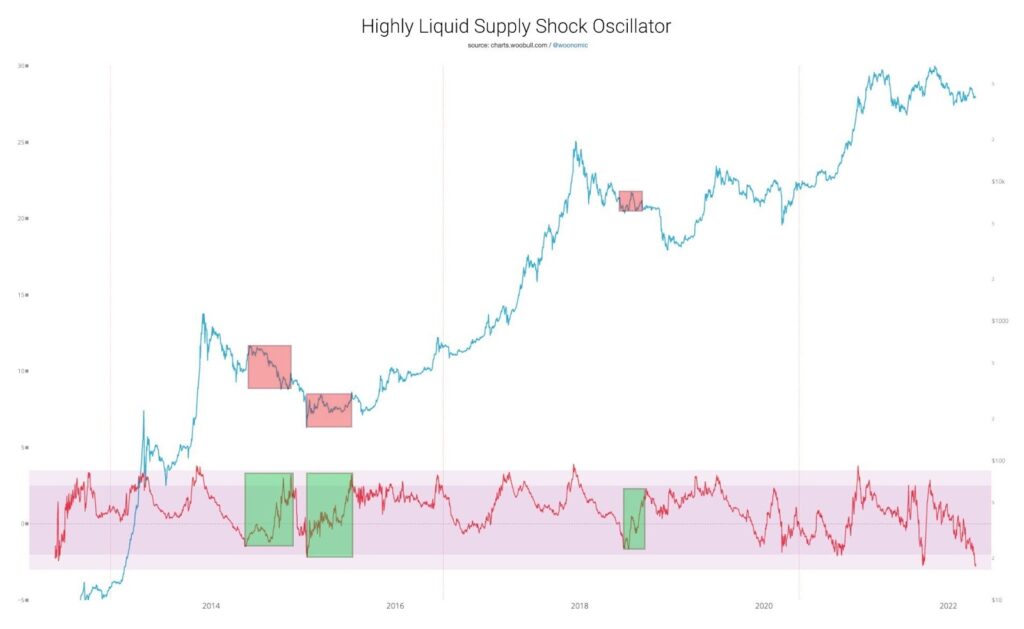
In reality, Willy Woo wrote the comment on his chart in a somewhat ironic way, as it appears that the indicator he was talking about is extremely oversold. In the chart, the analyst presented the highly liquid supply shock oscillator and compared it to BTC price history. We can see that this indicator is currently at an all-time low (ATL).
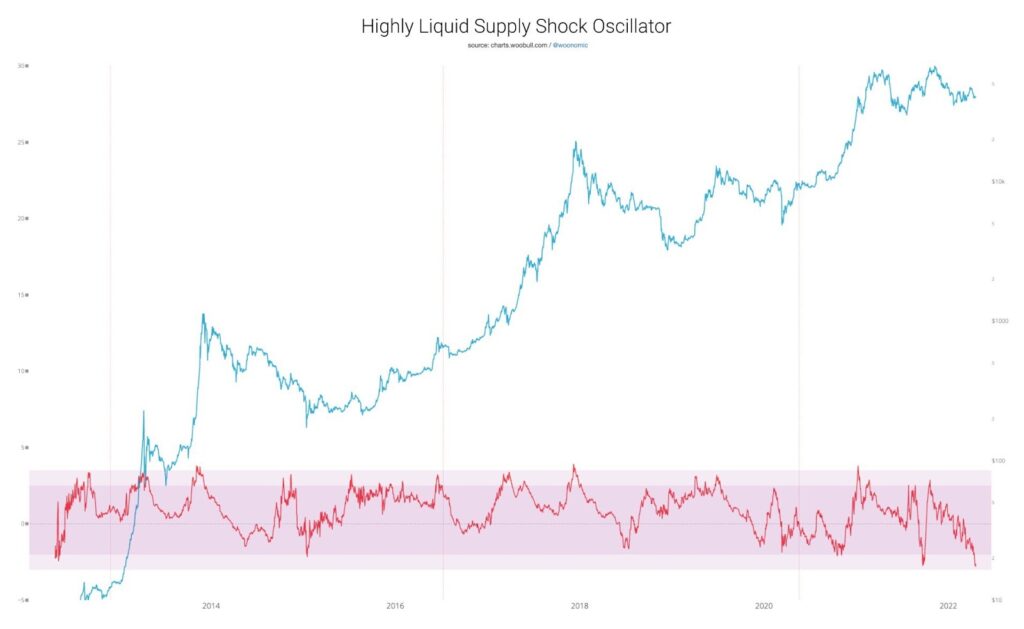
Further, Willy Woo writes: “Not a bad time for investors to wait for the law of mean reversion to play out.” He is referring to a theory in technical analysis that suggests that asset price volatility and historical returns eventually return to the long-term average or mean level for the entire data set.
In the case of the oscillator in question, this would mean that its chart would eventually bounce higher. This would lead to an increase in very liquid supply. How does this process correlate with the historical price of BTC?
Lows in highly liquid supply vs. the price of BTC
Foremost, it is worth looking at the periods when the highly liquid supply shock oscillator reached extremely oversold levels. The chart below juxtaposes the lows in the indicator with the price of BTC.
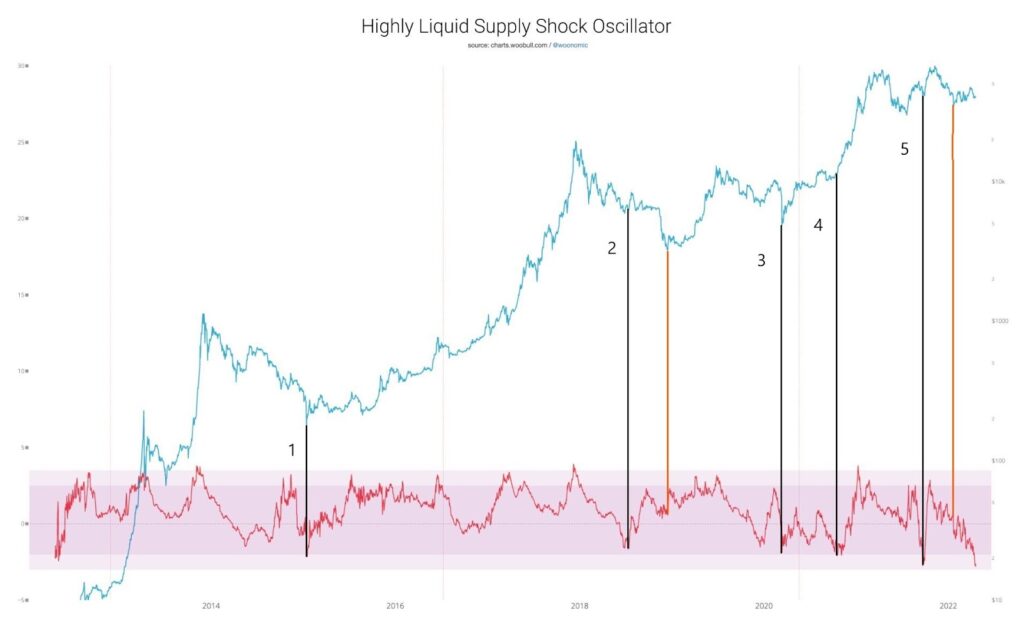
We find that in 3 out of 5 cases, lows in the supply shock oscillator coincided with macro lows in BTC price. This was the case in instances 1, 3 and 4. The oscillator bounced off the bottom and the price of Bitcoin never returned to such low levels thereafter.
However, in 2 out of 5 cases, the low level of the oscillator did not mark the absolute bottom of the BTC price. This happened in cases 2 and 5. True, the low level of the indicator signaled a local bottom for the Bitcoin price, but the price later dropped even lower (orange lines). Interestingly, the subsequent BTC bottoms were reached at higher oscillator values.
Trend correlation
Another way to examine the correlation between the two charts published by Willy Woo is to analyze potential trends. Hypothetically, one can assume that if the bottom of the oscillator matched the bottom of the Bitcoin price, once reached, one would expect to initiate an uptrend in both charts.
Indeed, historical analysis provides many examples of such a positive correlation. Most often they involve a dynamic uptrend that follows an extended period of accumulation. Two such cases occurred in the bull market of 2012-2013, two in 2016-2017, and two in 2020-2021 (green areas).
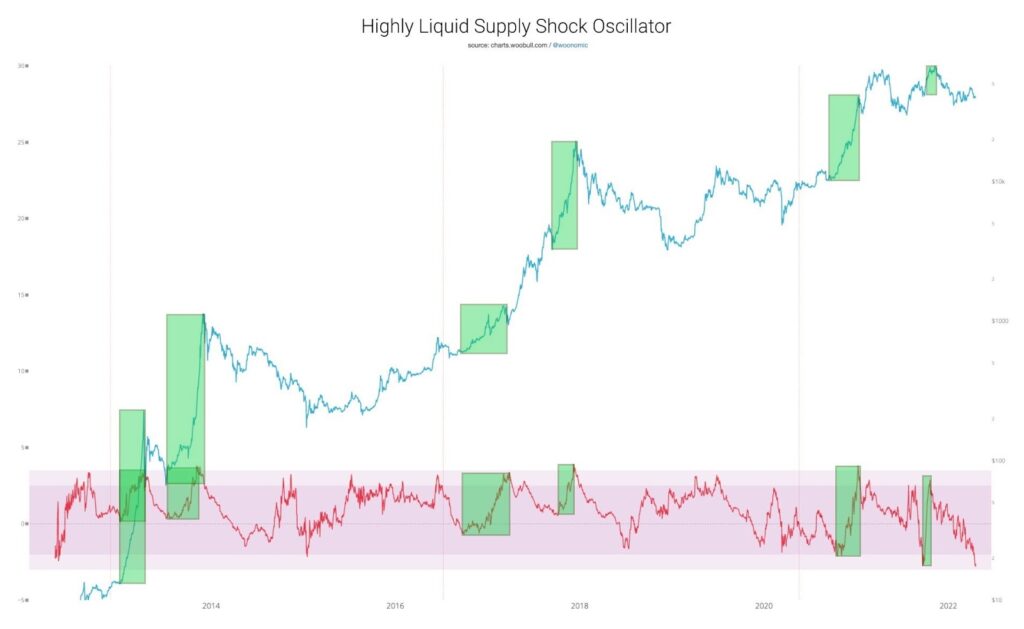
Sometimes, however, an increase in the highly liquid supply shock oscillator did not cause Bitcoin price to rise. We see three such instances – two during the 2014-2015 bear market and one during the 2018 bear market. At that time, the Bitcoin price was either falling or in a sideways trend. It was confirmation of a long-term bear market.
Conclusion
Today, the supply shock indicator presented by Willy Woo is at its ATL. This is potentially a bullish signal for Bitcoin prices. However, for it to be confirmed, the indicator – according to Willy Woo’s comments – must first of all turn back towards the mean.
Additionally, Bitcoin needs to resume its uptrend. If this does not happen, the rise of the highly liquid supply shock oscillator could lead to declines or further sideways movements in the price of BTC.