Be[in]Crypto takes a look at on-chain indicators for bitcoin (BTC), more specifically the Stablecoin Supply Ratio (SSR), and the circulating USDT supply.
What is RSS?
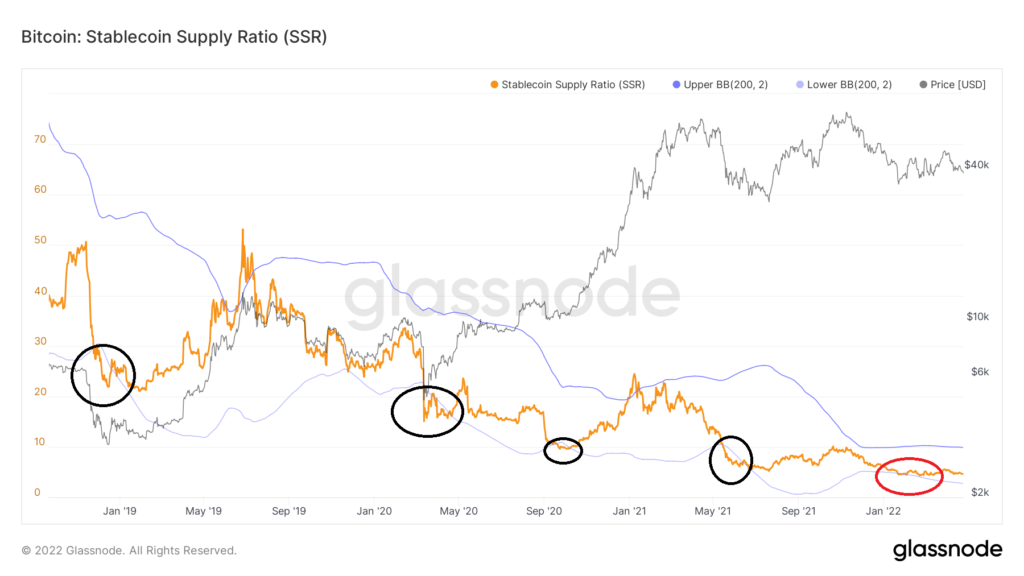
SSR is an on-chain indicator used to determine the ratio of stablecoin supply to bitcoin (BTC) supply. The indicator moves when there is a change in the supply of stablecoins or in the price of BTC.
Low SSR values show that a large percentage of the BTC supply can be purchased by using stablecoins. For example, a SSR value of 5 suggests that 20% (1/5) of the BTC supply can be bought by stablecoins.
Buy signal?
A buy signal has been given whenever SSR falls below the lower Bollinger band (black circle). This suggests that the indicator has fallen much more than it usually does.
Until now, there have been five such deviations. Four of them (black circle) led to considerable upward movements.
So far he has deflected four times. Each of them was followed by a very important upward movement.
On Jan 22, SSR reached a new all-time low value of 4.40, falling below the lower Bollinger Band (red circle). It bounced afterwards, alongside the BTC price, which increased to $46,000. Now, SSR is inside the bands, being closer to the lower one.
If this was the entire increase resulting from the SSR reading, it would be the smallest increase to date. SSR also suggests that another season is likely, something that has yet to happen.
USDT stablecoin balance
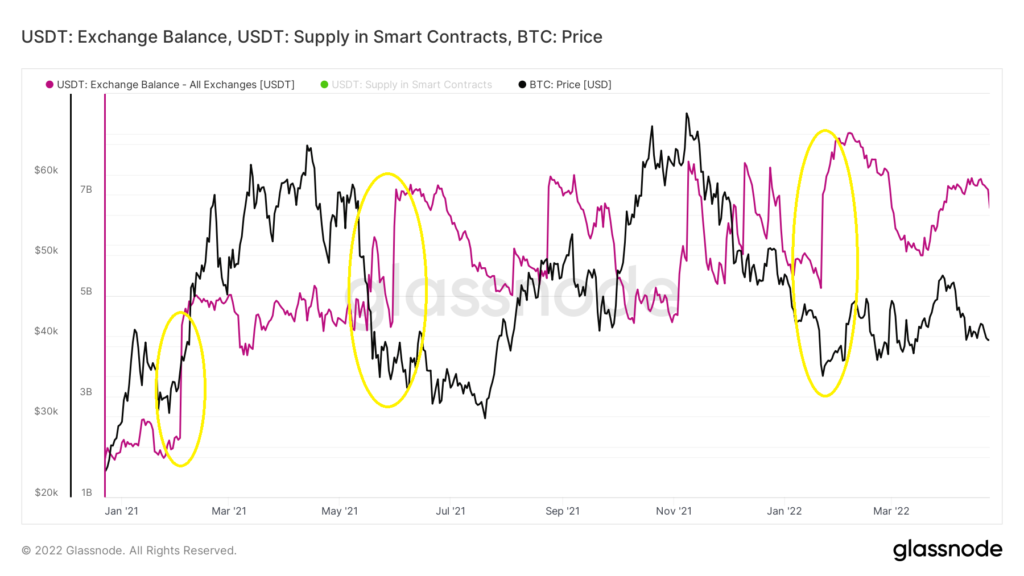
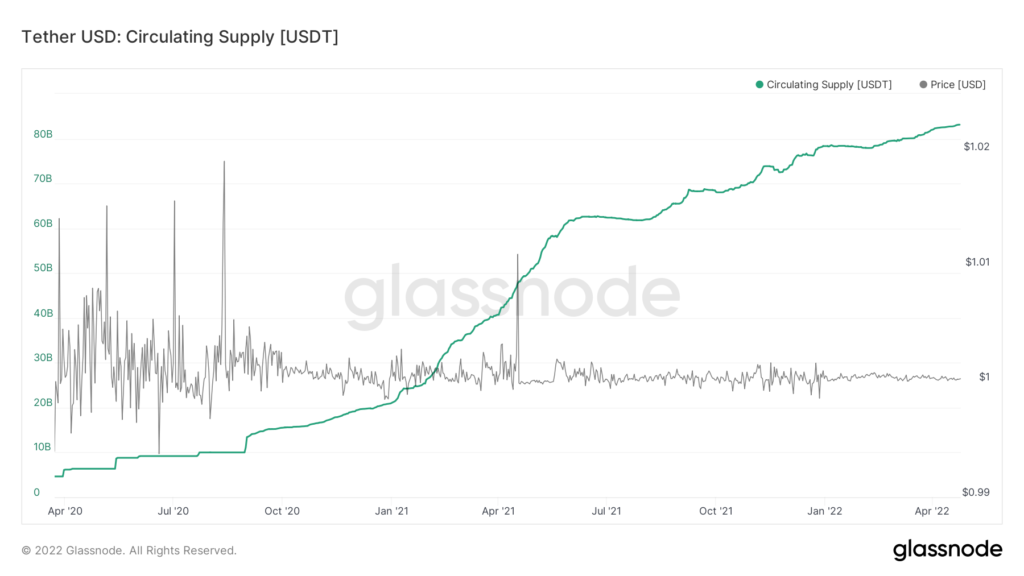
The circulating supply of USDT (green) has been increasing at an accelerated rate since March 2020. While the increase slowed down in Jan 2022, the circulating supply is still growing. In April, it reached a new all-time high of 83 billion.
An interesting observation is the fact that since January 2022 (black circle), the USDT balance on exchanges has increased, while the supply locked in smart contracts (green) has decreased.
The fact that the USDT held in exchange balances is increasing could mean that investors are preparing to ”buy the dip.”
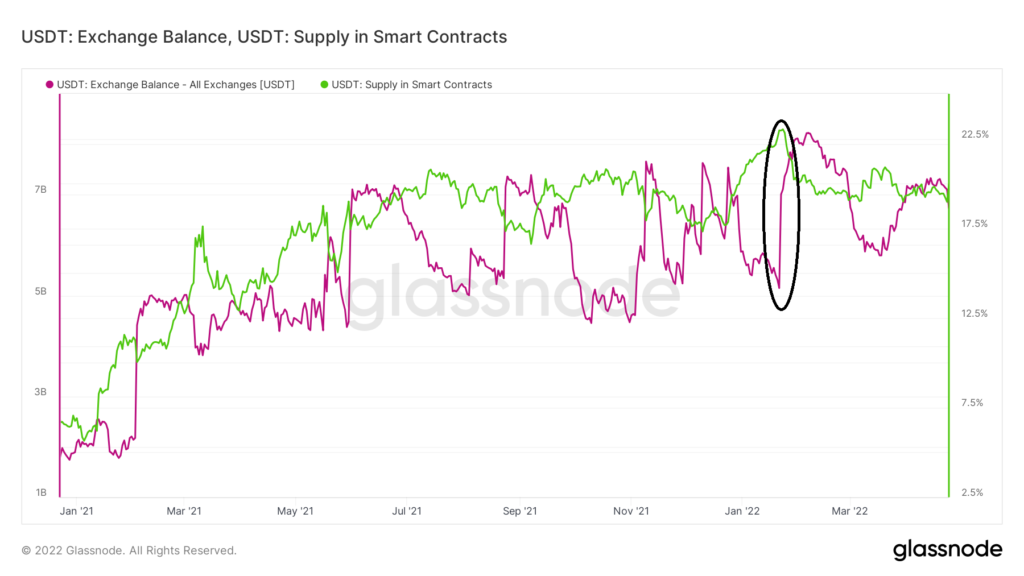
When looking at the stablecoin exchange balance and the price of BTC (black), it is visible that large USDT increases in exchange balances usually precede a price increase.
This was visible in both Feb and May 2021 (yellow circles). However, the sharp increase of Jan 2022 has yet to lead to a significant price increase.
That said, it is possible that a delayed price increase may occur, similar to what happened in May. 2021. Several patterns also suggest that the current BTC price is undervalued. Additionally, interest in the network seems to be at an all-time high.