Bitcoin (BTC) is in the process of breaking out from a descending wedge pattern, which has been in place since April 18. This could be the catalyst for a significant upward movement.
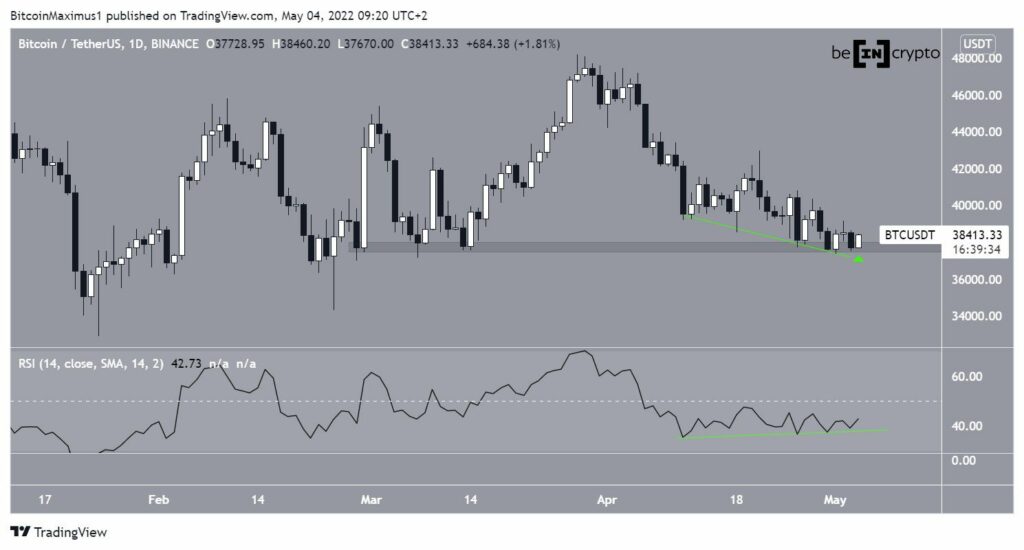
Bitcoin has been declining since hitting a local high of $48,189 on March 28. Since March 11, the downward movement has become very gradual and jerky. Since then, BTC has fallen less than 3%.
During this time, the RSI generated a considerable bullish divergence (green line). Such divergences often precede upward movements.
Additionally, BTC bounced off the $38,000 horizontal support zone. The zone has been acting as a strong horizontal support level since early March.
Today, BTC is in the process of creating a bullish engulfing candlestick. This bullish candlestick pattern would be confirmed with a close above $38,525. The creation of this bullish pattern would align with the bullish divergence that has been developing in the RSI.
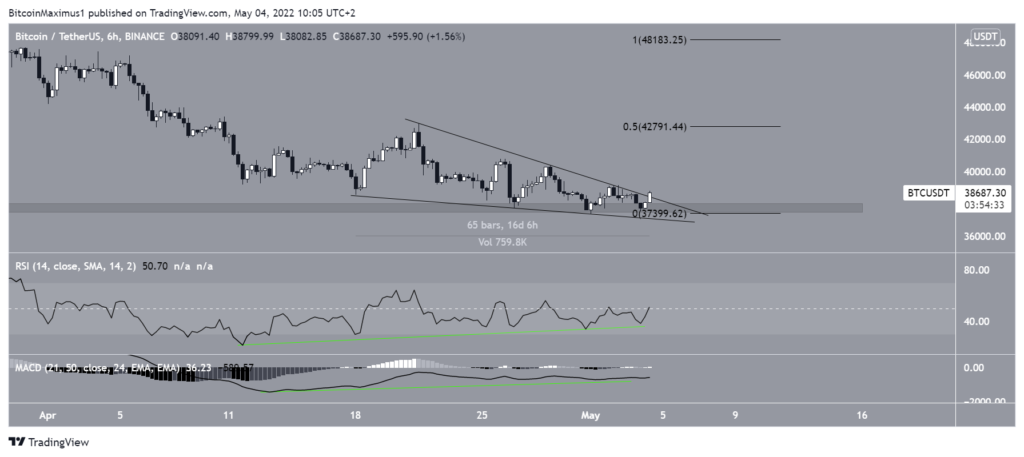
BTC attempts a breakout
The six-hour time frame shows that BTC has been trading inside a descending wedge since April 18. The wedge is often seen as a bullish pattern that leads to breakouts most of the time.
Furthermore, the pattern has been combined with a bullish divergence in the RSI and MACD, both of which support the possibility of a breakout.
If a breakout occurs, the nearest resistance zone would be found at $42,800. This objective is the resistance level at the 0.5 Fib retracement and the top of the wedge.
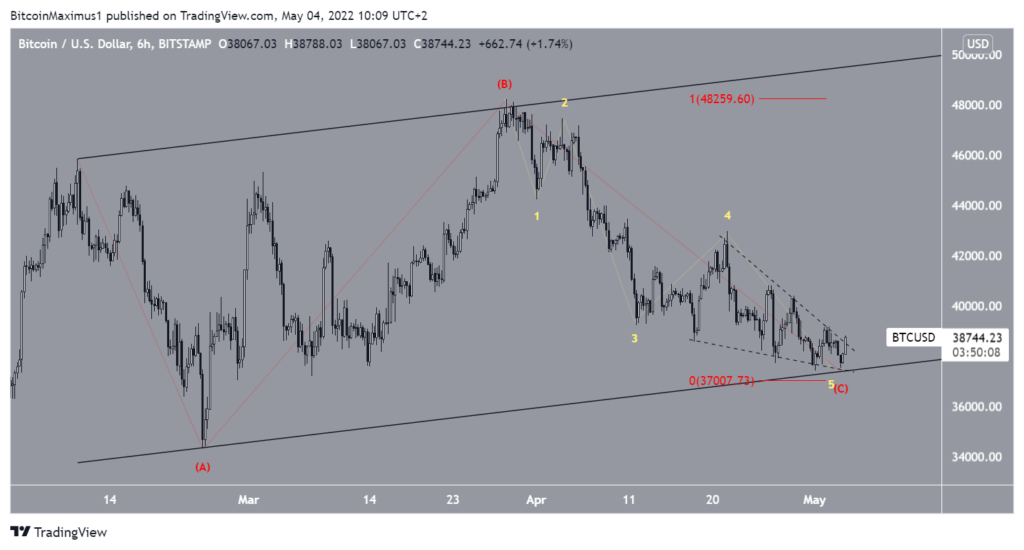
Wave count analysis
The most likely wave count indicates that BTC has been completing an A-B-C correction (red) since Feb. 10. The entire movement has been contained inside an ascending parallel channel. Since the bottom of wave C is higher than that of wave A, it is a running correction.
If BTC bottomed out, waves A and C would have an exact 1:1 ratio, which is common in such corrections.
The sub-wave count is shown in yellow in the chart below and suggests that BTC is in the fifth and final sub-wave, which has taken the shape of an ending diagonal, hence the shape of the wedge. A breakout from the wedge would confirm that the correction is complete.
If so, the long-term wave count suggests that significant upward movement would likely follow.