Ethereum price is traversing a bullish setup on a short-term outlook, suggesting a breakout to the upside soon. Interested investors can be patient and capitalize on the next leg-up that will push ETH to $3,200 and higher, especially if the bulls support it.
Will the Ethereum price take off soon?
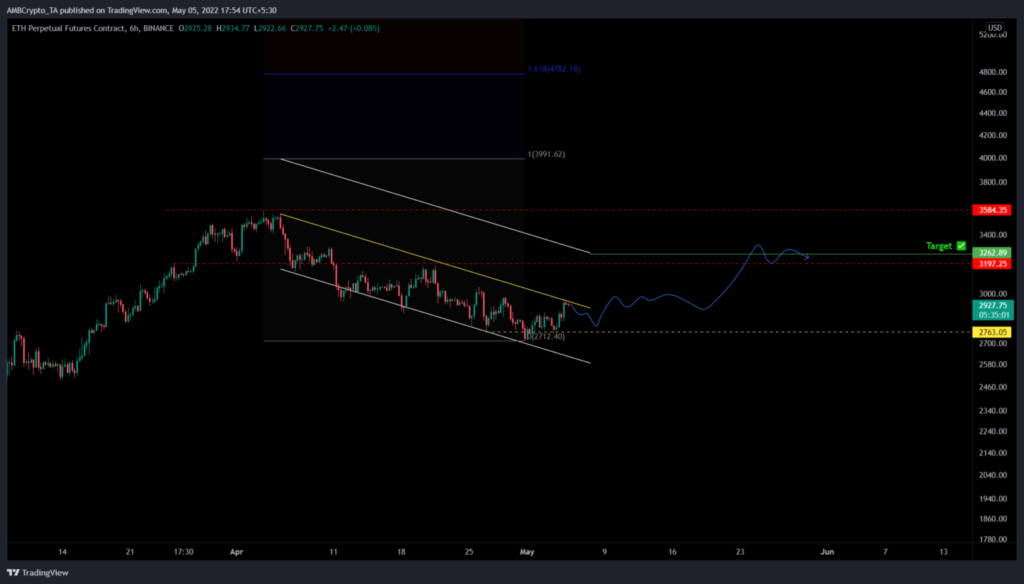
Ethereum price has been in a descending parallel channel and has been for exactly one month. In this time frame, ETH has set up three distinctive lower highs and four lower lows, which when connected using trendlines show a descending parallel channel.
As ETH retests the upper trend line for the third time there is a good chance for a breakout to occur in the next couple of days. However, there is likely to be a minor retracement to the $2,880, which will be a buying opportunity for interested investors.
Even beyond this support floor there is another one at $2,763, which will be the turning point for the long setup we are looking for.
A clean break above the channel’s upper trend line at roughly $2,975 will denote a breakout. In such a case, the technical formation setup forecasts a move equal to the width of the channel. Adding this measure reveals a target of $3,262, which will be our take-profit level.
Therefore, investors can capitalize on the 13% rally that has yet to begin. However, the $3,197 hurdle might reduce this acceleration, so buyers should be aware of this blockade.
In a highly bullish case, Ethereum’s price could shoot up to $3,584, bringing the total gain to 24%. Although unlikely, the best-case scenario could propel ETH to $4,000, constituting a 38% ascent.
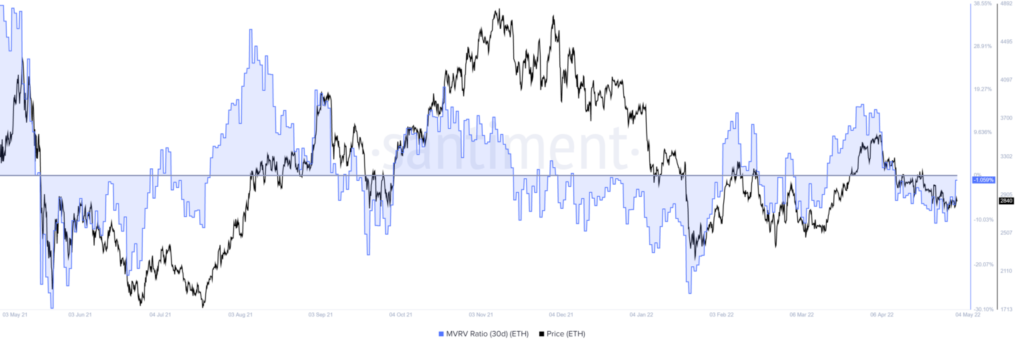
The 30-day Market Value to Realized Value (MVRV) pattern adds a tailwind to this long scalp idea for Ethereum price. This indicator is primarily used to gauge the sentiment of holders as it tracks the average profit/loss of investors who have purchased ETH tokens over the past month.
While a negative value indicates that these holders are underwater and are less likely to sell, a positive value indicates that holders are in profit, and the risk of a sell-off is high. Santiment’s backtests show that -10% to -15% is where long-term holders accumulate, leading to a local bottom formation. Therefore, the aforementioned range is termed an ‘opportunity zone,’ since the risk of a sell-off is less and it is a good place to buy.
Currently, the 30-day MVRV is hovering around 0%, but the local top is forming around 15%, indicating that there is still more to go north. Hence, supporting the bullish forecast from the technical perspective.