On-chain metrics for Ethereum noted that a two-year high on the ‘Number of addresses in loss’ was breached on 7 May. The NFT hype has been dying down as reports suggested a major downtrend in NFT sales.
Ethereum miners reportedly have larger mining revenues than Bitcoin miners for the month of April. Rising interest rates and their impact on global equity indices have been reflected in the price performance of Bitcoin and, with it, Ethereum.
Ethereum- 12 Hour Chart
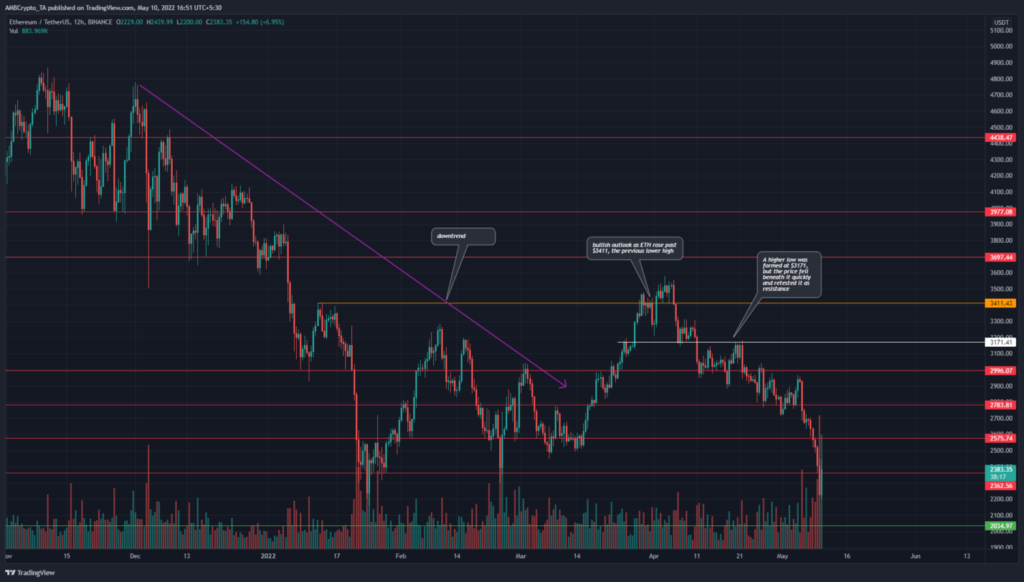
Ethereum has been in a downtrend since early December, but ETH bulls were fed some hope in March following a rally from the $2500 lows to push the price past $3411. In the latter half of March, the price breached the previous downtrend’s lower high and appeared to give a bullish bias to Ethereum on the higher timeframes such as 12-hour and daily.
However, following this move, the price was unable to establish a higher high. Instead, ETH slipped below the $3171 level and also retested it as resistance. Since this bearish retest, ETH has continued to drop below several support levels.
At the time of writing, ETH was once more in an area of demand. In January, the price of Ether plummeted to $2200 from $3400 just ten days prior to that. After testing $2200, demand was seen that pushed ETH back to the $3000 mark in February. Could something similar occur once more?
Rationale
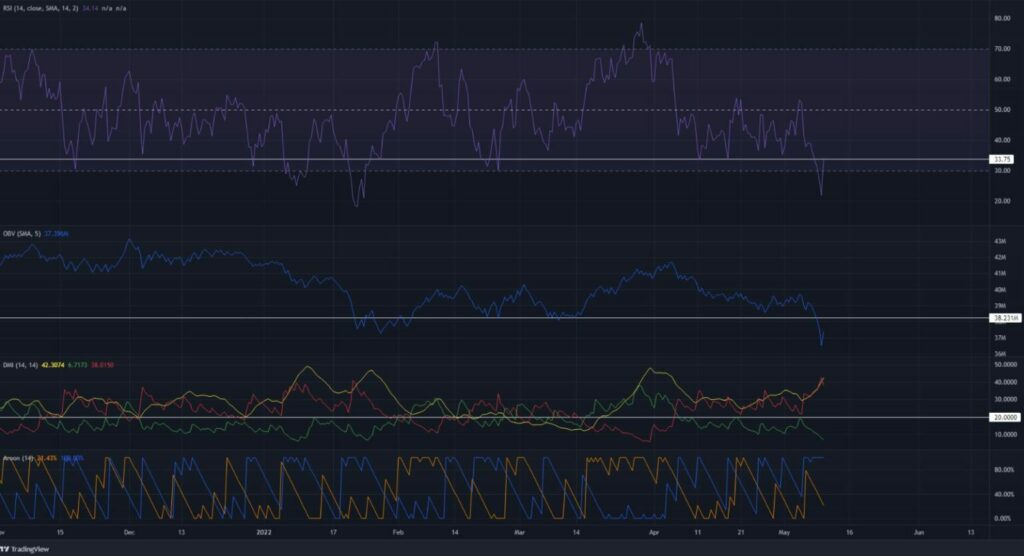
The RSI was below the 50 neutral line and is just resurfacing below the 30 mark. The momentum has been strongly bearish in recent days, but the 33 level of the RSI may hold the key to a rally in ETH. Similarly, the OBV fell below a level it had maintained since late January.
If the RSI can climb past the 33-mark, alongside the OBV climbing past the resistance overhead, it would be a strong sign of an Ether recovery in the weeks to come.
In the meantime, momentum and trend continued to remain bearish. The DMI showed a strong downtrend as the ADX (yellow) and -DI remained above 20. The Aroon indicator showed a mostly bearish trend over the past month as the Aroon Down (blue) remained high on the indicator.
Conclusion
Risk-averse investors would want to see the $2500-$2550 area reclaimed by the bulls before buying the crypto asset. More risk-loving traders can attempt to buy some ETH near what could be a bottom, but this would be a risky venture indeed.