
In today’s article, BeInCrypto looks at 6 selected on-chain indicators whose charts suggest that Bitcoin is very close to reaching a bottom. These were highlighted in a tweet yesterday by Will Clemente – a well-known on-chain analyst – who suggests that “it’s a great time to DCA heavily.”
Will Clemente is as young (20) as he is popular (630,000 subscribers) on Twitter) a next-generation on-chain analyst. He hosts the Blockware Intelligence Podcast and writes a weekly newsletter on on-chain analytics, mining, and digital assets.
DCA and the multi-generational bottom
His tweet yesterday initiated a discussion on the argument that a bottom in the price of Bitcoin and the entire cryptocurrency market is imminent. Clemente makes this part of the narrative he promotes that the last few months represent the best opportunity for an investment strategy called “dollar cost averaging” (DCA).
DCA involves an investor dividing the total amount to be invested into periodic purchases of assets of interest. In this way, he tries to reduce the impact of volatility on the total purchase. Purchases are made regardless of the price of the asset and at regular intervals.
Will Clemente then added a strong entry that he believes Bitcoin is very close to an important market low today:
“Now, I believe Bitcoin is very close to a galactic, multi-generational pico-bottom where I plan to allocate all of my dry powder to my grandchildren’s grandchildren.”
One has to admit that for a 20-year-old, this is a very powerful, even visionary statement. Of course, the analyst does not leave it without proper arguments to support his strong conviction.
Will Clemente: 6 arguments
So let’s take a look at the 6 on-chain indicator charts he presented. Indeed, they suggest that Bitcoin is today close to levels characteristic of previous bear market all-time lows. Moreover, they are online with many on-chain analyzes from the BeInCrypto team.
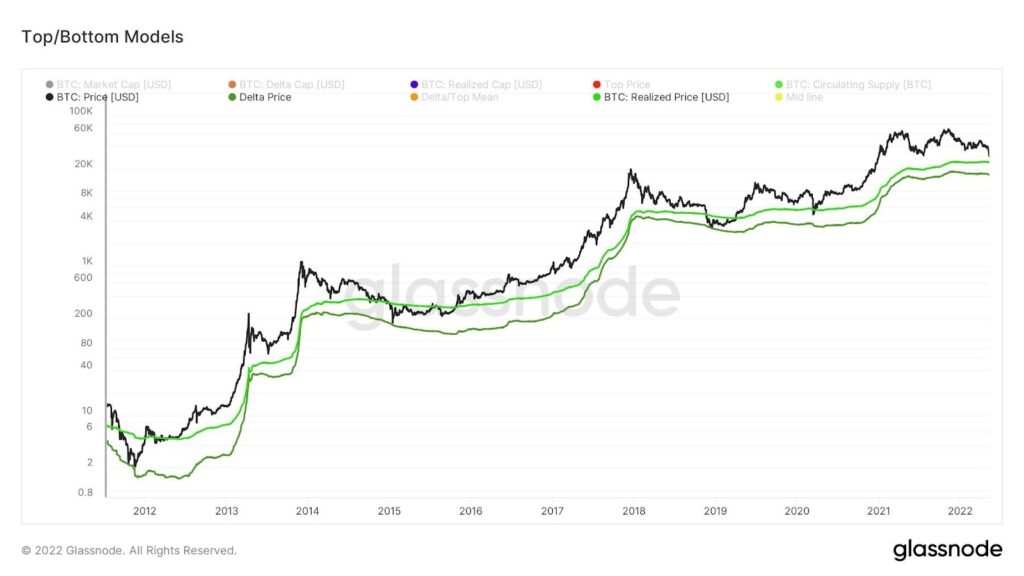
Top/Bottom Models
The first chart that Will Clemente presents is the so-called Top/Bottom Models. It contains charts of two indicators: Realized Price and Delta Price. The former (light green line) is the ratio between the realized market capitalization of Bitcoin and its running supply. It currently sits just above $24,000.
On the other hand, the second indicator, Delta Price (dark green line), has served well in the past to determine the absolute lows of bear markets in 2011, 2015 and 2018. This indicator is based on the so-called Bitcoin Delta La capitalization, which is the difference between the realized capitalization and the average capitalization – the moving average to date of the market capitalization.
In the chart, we can see that Delta Price is today well below the December 2017 historical all-time high (ATH) of $20,000. Somewhat contrary to Clemente’s arguments, if Bitcoin were to dive below this level, the current price is certainly not close to a bottom. On the other hand, if the bottom is to be set by Realized Price this time, the $24,000 level could serve as ultimate support.
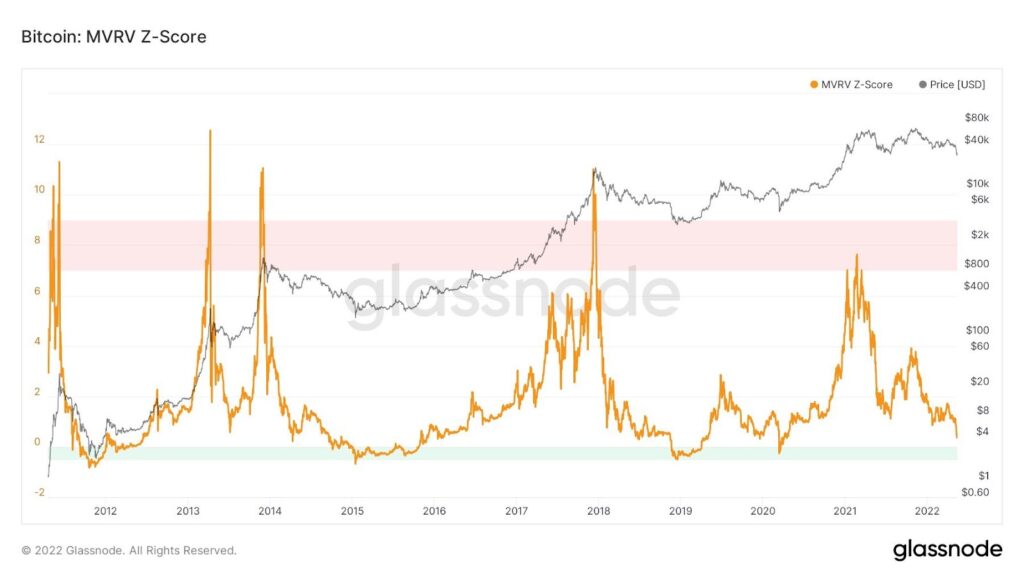
Z-score MVRV
In his second argument, Will Clemente uses the MVRV Z-Score. It is used to assess when Bitcoin is overvalued/undervalued relative to its “fair value”. When the market value is significantly higher than the realized value, this historically indicates a market top (red area), while the opposite situation indicates a market bottom (green area). Technically, the MVRV Z-Score is defined as the ratio of the difference between market capitalization and realized capitalization, and the standard deviation of all historical market capitalization data.
In the chart, we see an ongoing decline in the indicator toward the green zone, which, however, has not yet been reached. Indeed, in the past, staying in it and sometimes even falling below (2011 and 2015) has been a marker of an absolute bottom for the BTC price. Therefore, it seems that despite the low value of the indicator, there is still room for a continuation of the downward movement.
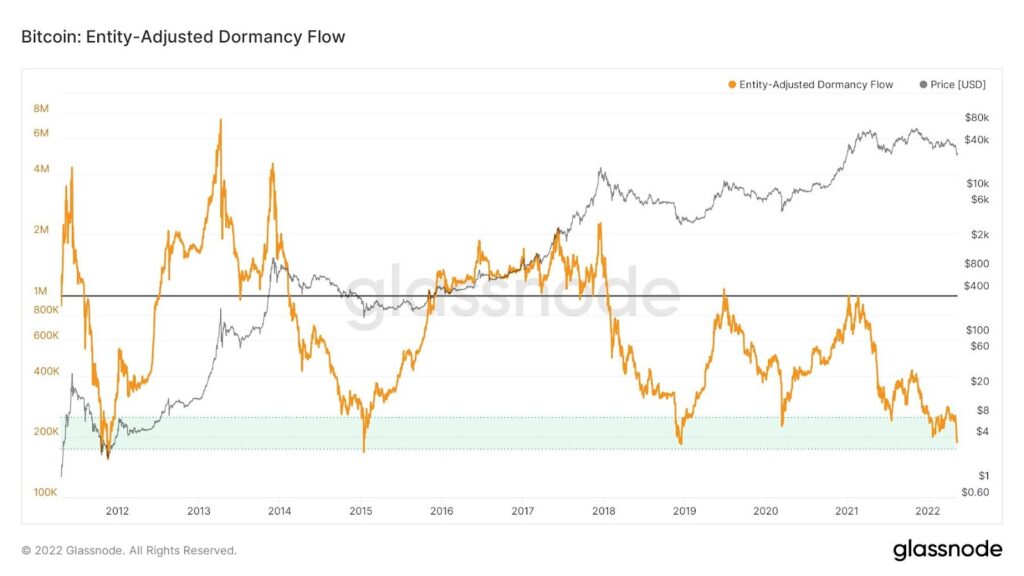
Entity-adjusted dormancy flow
Another indicator is the entity-adjusted dormant stream, which BeInCrypto recently wrote about. This indicator is an improved version of the Average Coin Dormancy, which shows the average number of days destroyed per coin traded. Its improved version rejects transactions between addresses of the same entity, giving a better market signal and reflecting real market activity.
According to Clemente, the indicator “has been in the “buy” zone for the last few months but is now approaching levels that previously set generational bottoms.” In fact, looking at the chart, we see that the indicator is already firmly below the bottom of the COVID-19 crash in March 2020. Moreover, it is close to reaching the December 2018 area when BTC fell to the $3150 level.
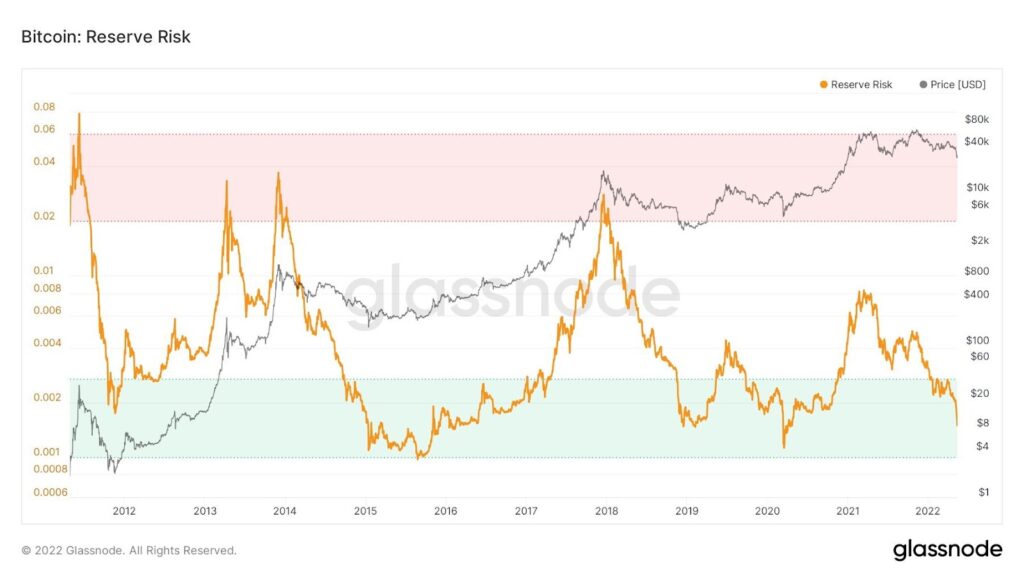
Reserve risk
Next, Clemente turns his attention to Reserve Risk. This indicator is used to assess the confidence of long-term holders in the price of Bitcoin at a given time. When the confidence is high and the price is low, the reserve risk reaches low values. When the confidence is low and the price is high, the indicator gives high readings.
Currently, the chart has been in the green low-risk zone for several months. However, unlike Entity-Adjusted Dormancy Flow, the March 2020 level has not yet been reached here. Clemente says the low Reserve Risk level is “illustrating holder confidence relative to price.”
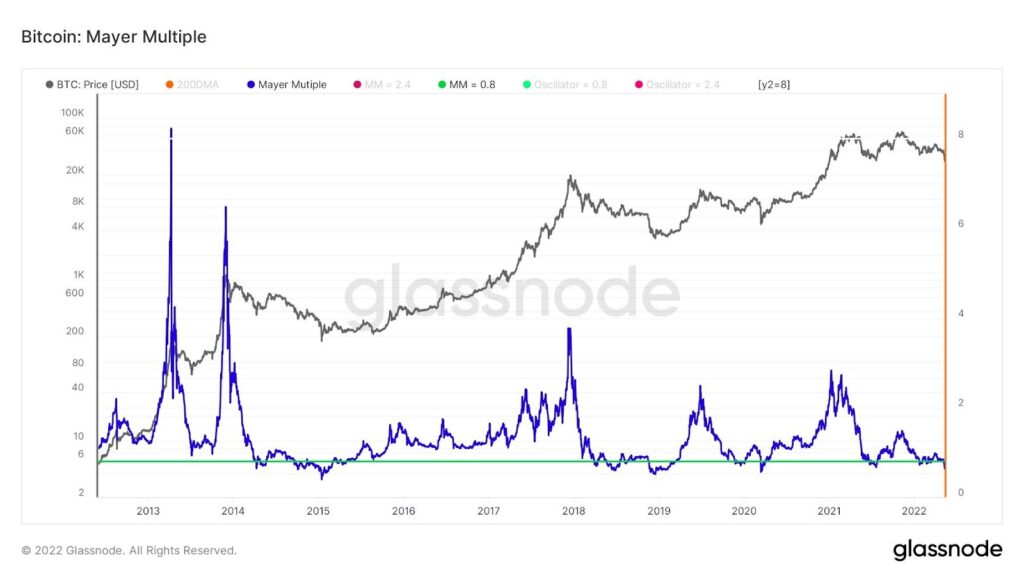
Mayer’s multiple
The fifth indicator presented by the analyst is the Mayer multiple. It is an oscillator calculated based on the ratio of the price of BTC to the 200-day moving average (200D MA). Bitcoin’s all-time lows were usually hit when this indicator fell significantly below 1. For example, the 2018 low brought the Mayer multiple to a value of 0.53.
Currently, the indicator reaches a value of 0.63, according to data from Woobull Charts. Here again, Clemente emphasizes that this is “the buy zone, almost at historical lows.”
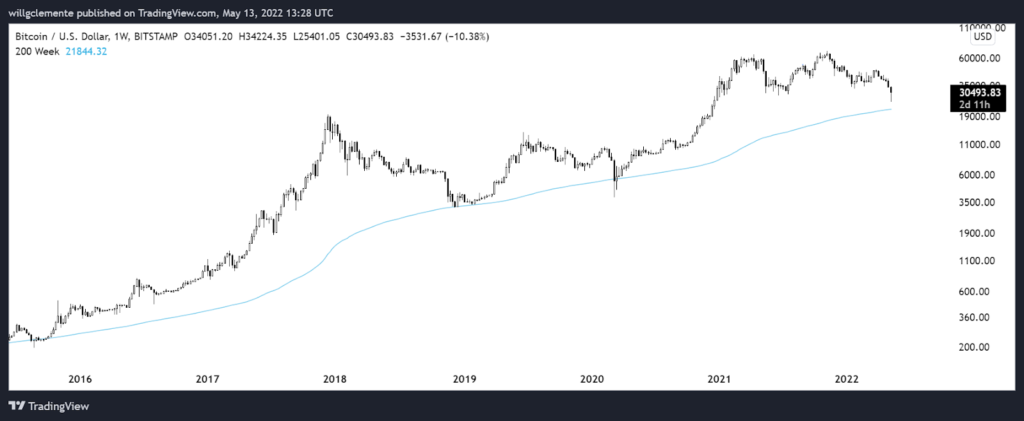
200 week moving average
The last indicator Will Clemente refers to is the 200-week moving average (200W MA). Of course, this indicator is not from chain analysis, but is a traditional technical analysis indicator. In the long-term BTC chart, the average served as the ultimate support for any bear market. However, there have occasionally been long wicks or even weekly closes underneath.
Currently, the 200W MA is located at the $21,832 level. Reaching this valuation would involve Bitcoin falling another 25% from its current value. It is worth noting that this level is just below the $24,000 Realized Price chart presented in the first argument.
Conclusion
The above 6 arguments made by Will Clemente may indeed suggest that a bottom in Bitcoin price is about to be reached. However, in each of the charts above, we can see that historical lows have yet to be reached. Several indicators even suggest the possibility of a decline at or below $20,000, i.e. testing the ATH level of the previous cycle. Such a situation has never happened before in the history of Bitcoin.
Will Clemente summarizes his arguments this way:
“Based on the aggregation of these measures and price levels; the low is most likely in the low to mid $20,000s, which matches the previous ATH theory.
He then adds, in line with his DCA strategy, advice for long-term investors: “Question to ask yourself is in 2 years will buying at 29K versus MAYBE sniping the bottom matter? Prob not, but I will try.”