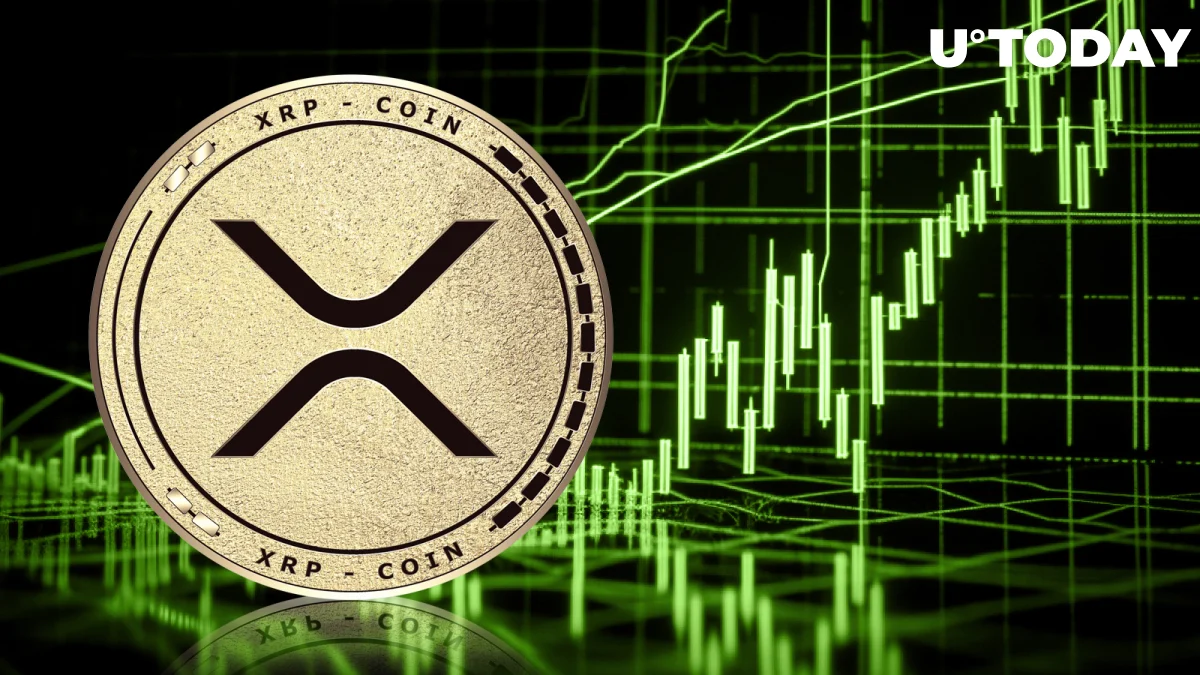
Yearly charts can provide insightful information about a cryptocurrency’s long-term prospects that shorter time frames can miss. Considering the turbulent events that have surrounded the commodity in recent years, the annual chart for XRP shows a surprisingly positive picture.
The annual chart for XRP displays an overall upward trend, with each candle on the chart indicating the performance of the asset over a full year. Notably, the $3.32 high and subsequent decline seem to represent a natural ascending trajectory with reversals at regular intervals. This shows that the asset has room to increase, especially when taking into account general market trends and impending events that can affect its valuation.
One such occasion is the SEC’s (Securities and Exchange Commission) forthcoming appeal of a judge’s finding that XRP is not a securities. As investors hurried to profit on the good news, this court win led to a huge increase in the market value of XRP.
It is important to note that around a month later, the price of XRP reached its pre-pump levels. The market either overreacted to the news, or the asset’s general positive trajectory was maintained by the return to earlier levels, which may be viewed in one of two ways.
XRP’s future will definitely be significantly impacted by the SEC’s appeal, but the annual chart indicates that the asset has the fortitude to withstand legal storms and emerge stronger. If the appeal sustains the original decision, it may act as a spark for additional growth, possibly driving XRP to new annual highs.


