Over the past few weeks, cryptocurrency markets have plunged due to macro-level fear (risk off). In this analysis, we will take a closer look at the price of bitcoin from a technical perspective, Onchain and Options Markt and discuss possible scenarios in the short to medium term.
Technical Analysis
Long-Term Analysis
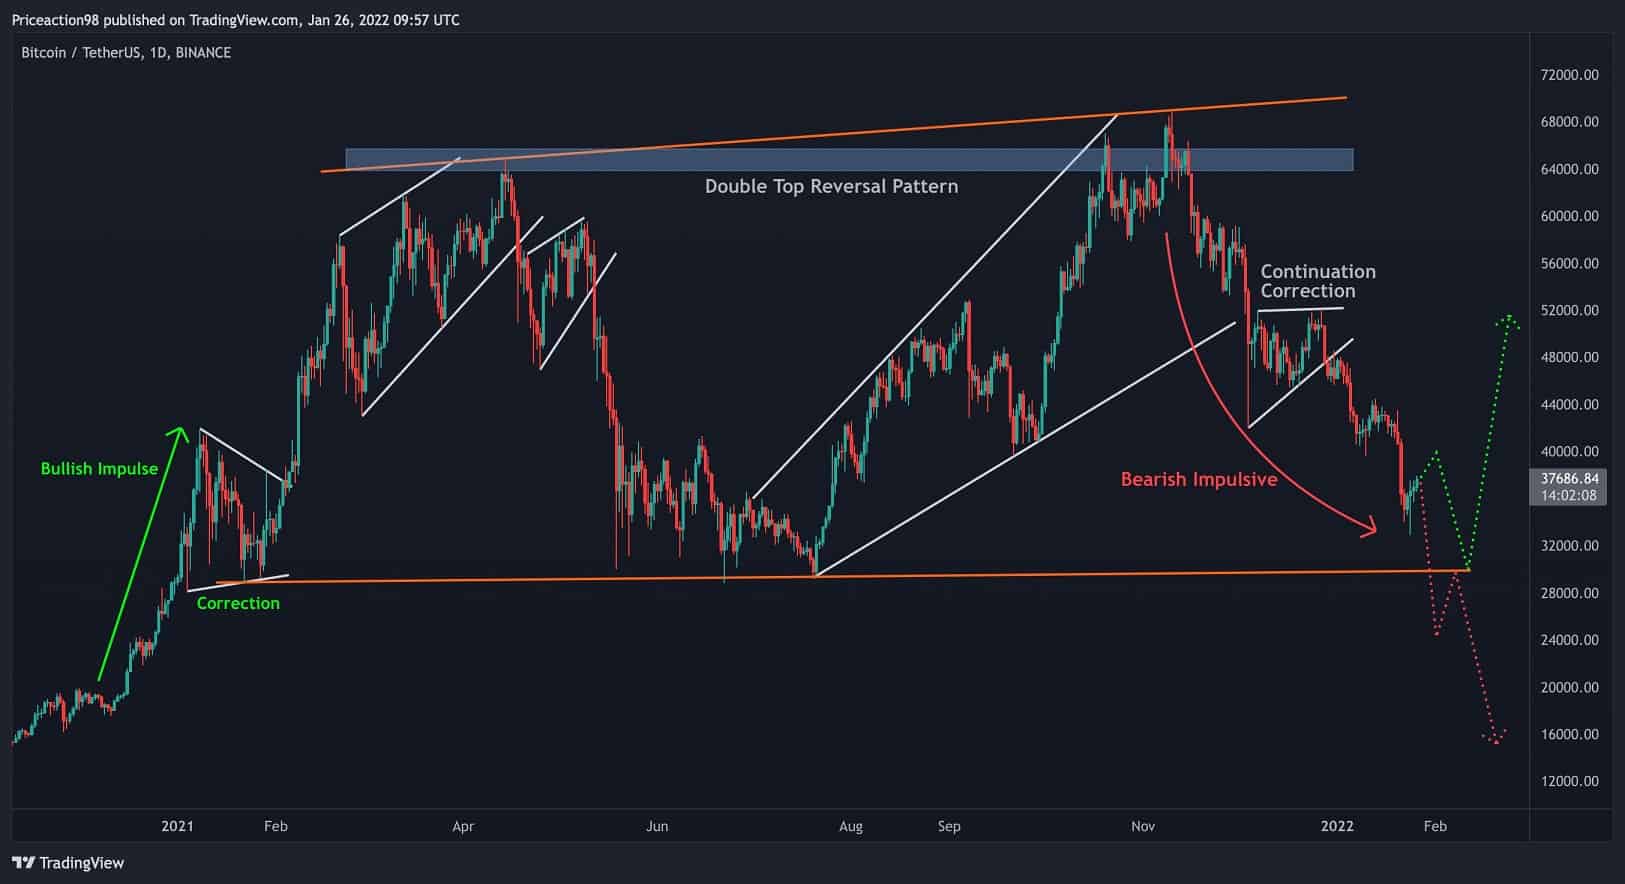
We can observe how the price organically evolves into a larger corrective structure following the first bullish impulse phase. A few swing highs and lows appear, which assist in identifying a corrective structure.
Overall, the price of BTC has created a double top, an ascending channel, and a head and shoulders pattern from the all-time high region (November 10, 2021), providing us with a confluence of selling.

Since November, the BTC price has been in a downtrend, with smaller time frame’s corrections. A consolidation might occur because we haven’t reached the prior swing lows, pushing the price down to the previous higher time frame (HTF) lows and completing the whole pattern.
It is essential to wait and watch if a positive reversal price action forms until the price reaches the lower region (marked by the orange line on the chart above). These confirmations are important in determining if the price can restart another bullish leg.
Short-Term Analysis
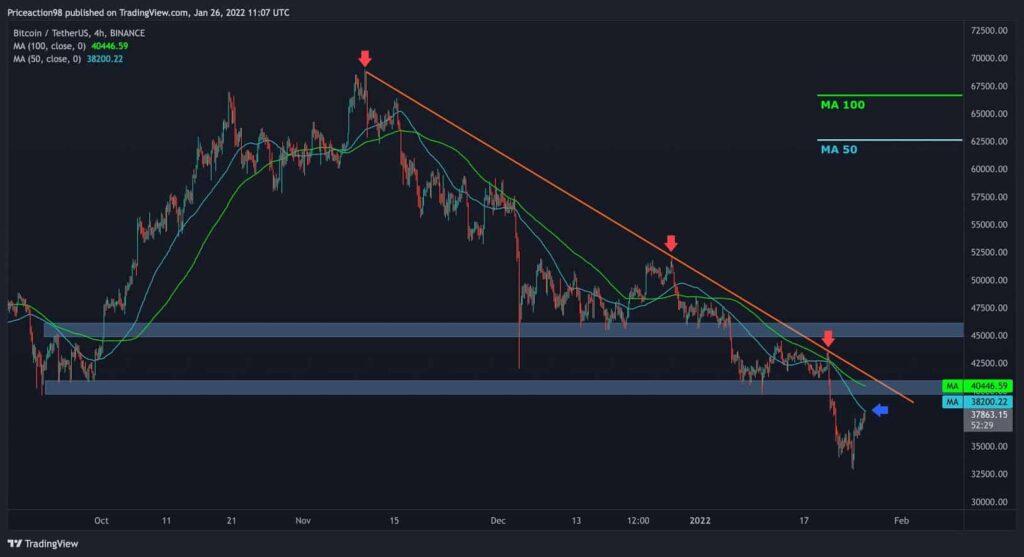
As shown in the following 4-hour time frame chart, the price is in a clear downtrend, which started since BTC hit ATH at $69K.
The marked ascending trendline acted as substantial resistance to the price. Bitcoin has many important resistance levels en route to reclaiming the $40-50,000 price range, so it needs to form a higher pattern to rebound and start a new rally.
In case bears continue, then further support level is the previous low in the higher time frames, which is the $30K zone.
On-chain analysis
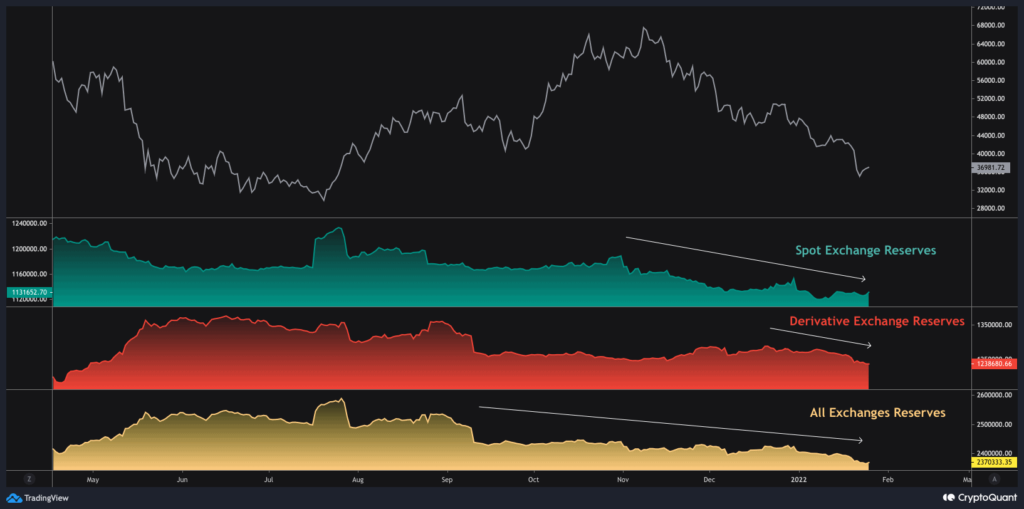
One of the key metrics signaling impending bearish momentum in the fourth quarter of 2021 was the rise in derivatives exchange reserves.
Asymmetrically, the spot exchange reserves have been in a long-term depletion, and this contradiction indicates that the dips got quickly bought and withdrawn from the Spot exchanges. So, it is evident that we are in an accumulation phase, which is bullish for the mid to long term.
Options market analysis
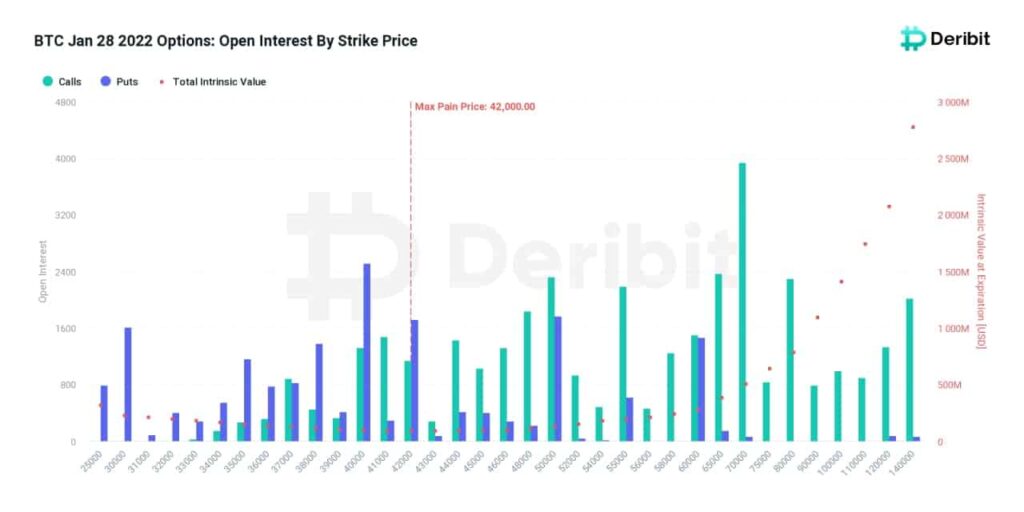
This Friday, January 28, approximately $2.1 billion in Bitcoin options contracts will expire on Deribit. This is the most important expiry of this month.
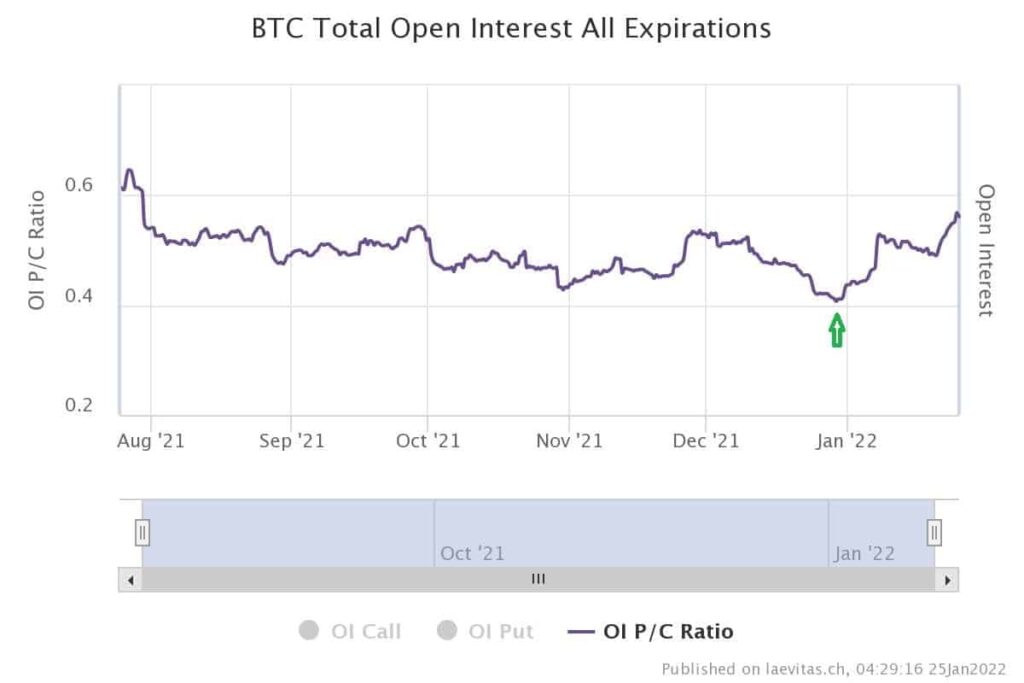
Max pain price is $42K, and the P/C Ratio is 0.5. According to extreme fear in the market and spot sell-off, options traders sold calls and bought puts in order to hedge any downside due to the upcoming Fed’s meeting (19:30 UTC on Wednesday). P/C Ratio has increased since January, indicating a bearish sentiment in the options market.