
Bitcoin was supported by both dynamic and static support levels on the daily frame. However, from the online channel’s perspective, the intensity of whaling activity signals possible short-term selling pressure. It remains to be seen if it can be absorbed by buyers and see bitcoin break above the next major resistance around $48,000.
Technical Analysis
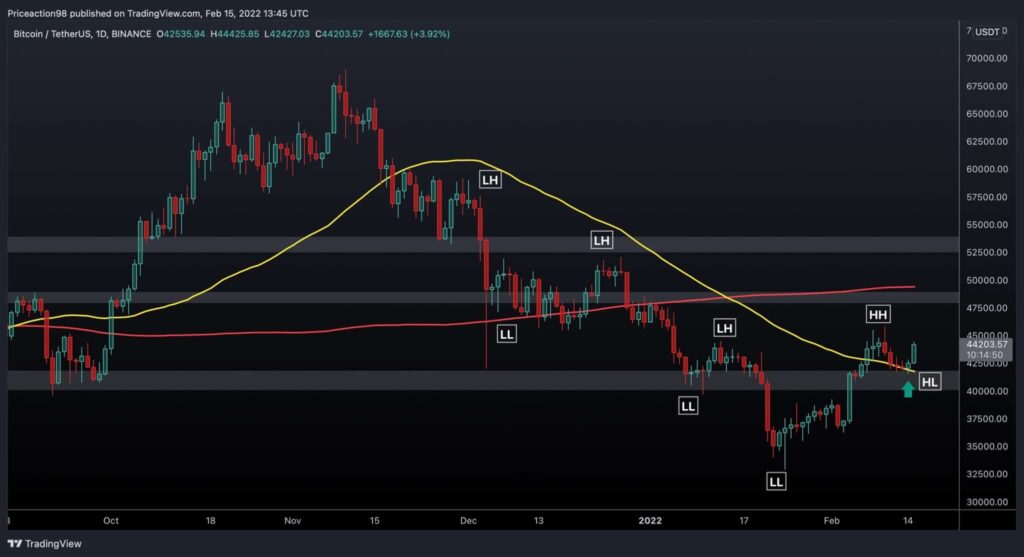
Long-Term
Bitcoin has been supported by the 100-day moving average and the $40K-$42K support zone simultaneously. The next major resistance area will be the $48K zone and the 200-day moving average. A new all-time high will become more probable if Bitcoin successfully breaks and consolidates above these two levels.
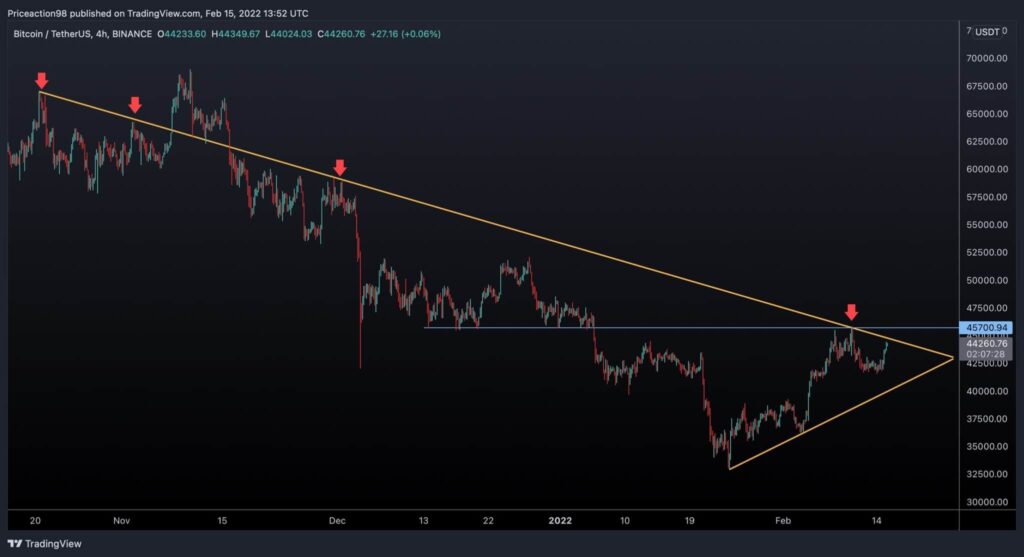
Short term
On the 4H timeframe, the price is currently testing a major downtrend line. If it can break this trendline, the next short-term resistance will be the $45.7000 level (blue horizontal line). However, a pullback towards the demonstrated uptrend line is expected if the price is rejected from the mentioned levels. A breakout of the ascending line can cause BTC to drop deeper and test the bottom of $33,000.
Onchain Analysis
Historically, high values of the whale ratio metric have led to a price correction. It is calculated by dividing bitcoin’s top 10 inflows to exchanges by all the inflows in a day. In this situation, we can conclude that the whales are depositing BTC to exchanges rapidly, and a correction is highly probable. In the last couple of days, the Whale Ratio has spiked – a bearish signal for the short term.


