Bitcoin’s (BTC) RSI has turned bullish in the daily and weekly time frames, but the price action has yet to catch up with this trend reversal.
Bitcoin created another small bearish candlestick during the week of May 23-30. From the week of March 28 to April 5, this was the ninth consecutive bearish weekly candlestick. It also caused an outage of a long-term ascending parallel channel.
Despite this occurrence, the price has not yet dropped below its May 12 low of $26,700.
Currently, the price is trading just above $28,700 which is the 0.618 Fib retracement support level. Although considered a crucial Fib support level, BTC fell below the $30,000 horizontal support. As a result, there now remains more horizontal support until below $20,000.
It’s also worth mentioning that the weekly RSI is currently at 34. This is the exact same value as the March 2020 crash. Since 2017, the only other time the RSI has generated a lower value was during the December 2018 bottom of $3,300.
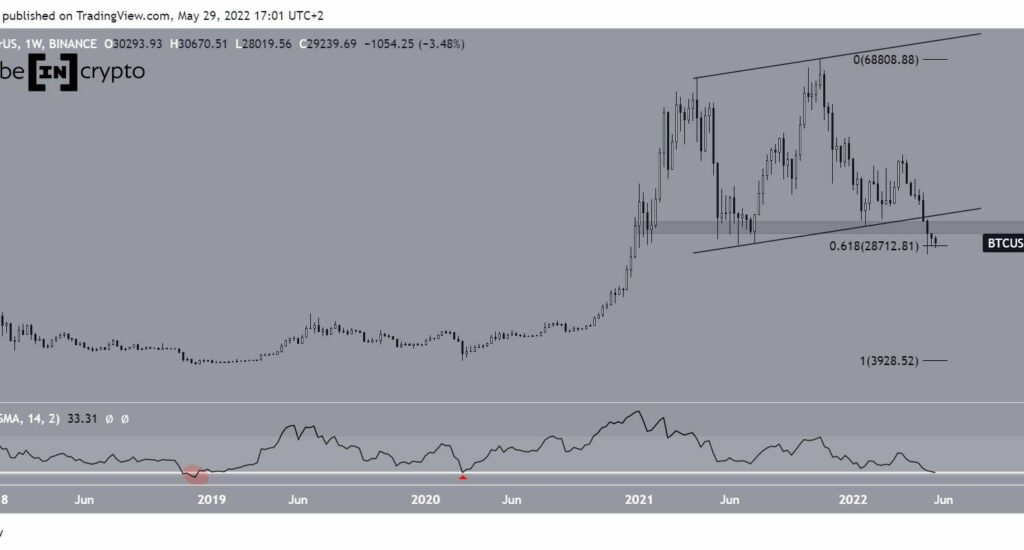
The weekly chart looks mixed overall. On the bullish side, the RSI has reached values that were previously associated with lows, and the price is trading above the Fib support.
On the bearish side, the price has broken down from an ascending parallel channel and horizontal support area.
Bearish price and bullish RSI
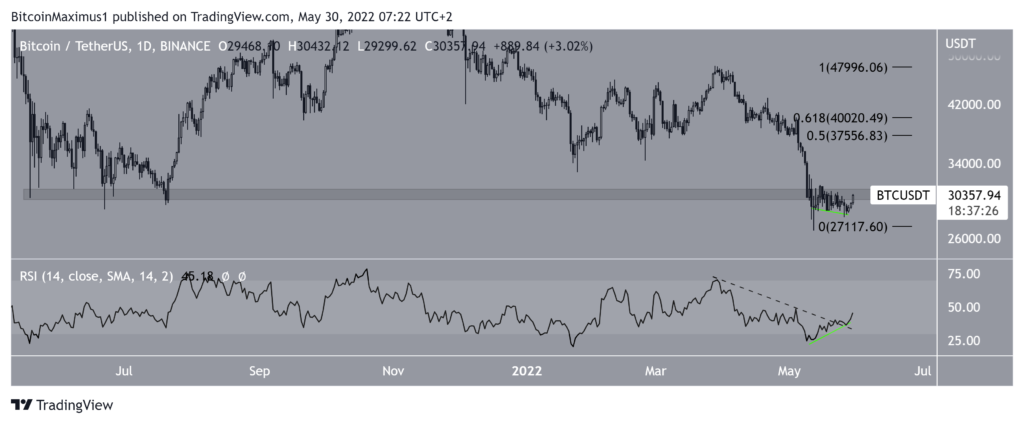
The daily chart supports the interpretation of the weekly overview, in which the price broke down from a horizontal support level. In this time frame, the horizontal level now facing resistance lies at $30,500.
Despite this occurrence, the daily RSI is decisively bullish.
First, it generated considerable bullish divergence (green line), a move that often precedes bullish trend reversals. Also, the indicator came out of a descending trend line (dotted, black).
If this event initiates a BTC upward movement, the next closest resistance area would be between $37,500-$40,000. This target range is the 0.5-0.618 Fib retracement resistance area.
Thus, the daily chart is slightly more bullish than the weekly chart. Despite the fact that the price is trading below the horizontal resistance, the RSI is decidedly bullish.
BTC wave count analysis
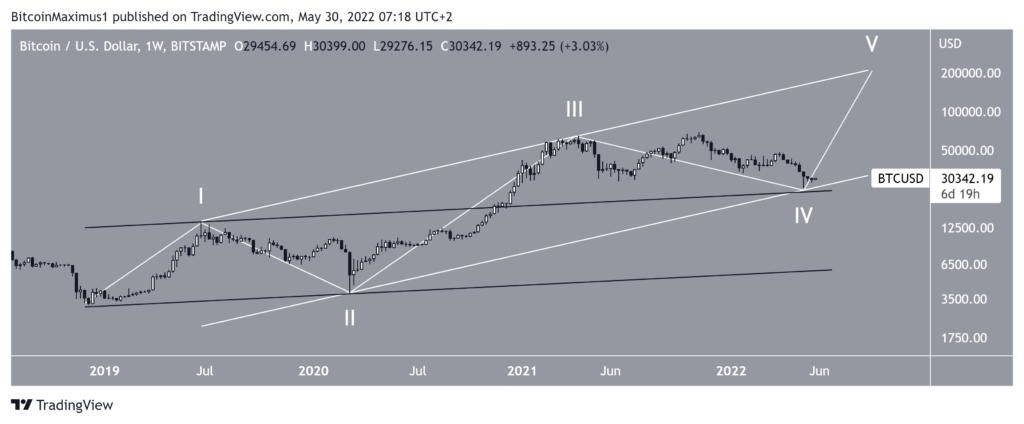
The long-term count supports the readings from the weekly RSI, which suggest that BTC is close to or has already reached a bottom. It indicates that the price has completed wave four of a five-wave long-term upward movement that began on Dec. 2018.
The May 12 low was reached at a confluence of support levels:
- A parallel channel created by connecting the highs of wave one and three and projecting them down wave two (white).
- A parallel channel connecting the highs and lows of waves one and two.
A decisive breakdown below the white channel would indicate that this is not the correct count and the price is still in a bearish trend.
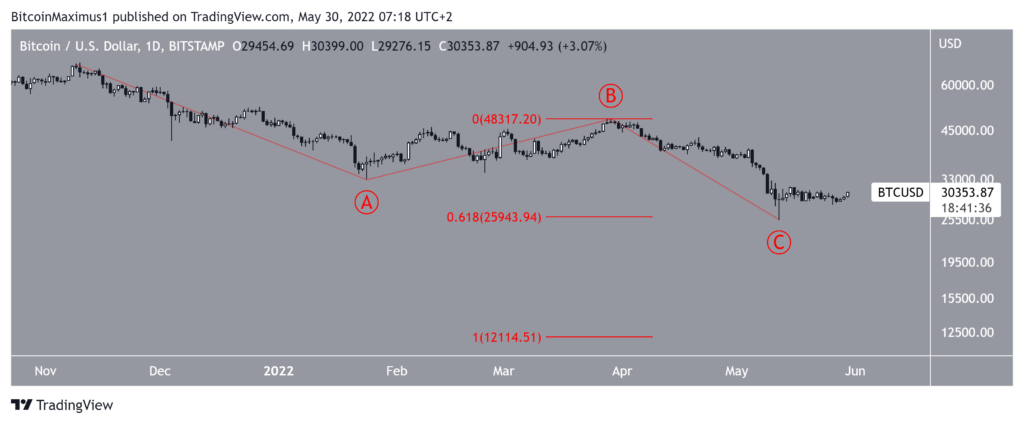
The daily chart outlook suggests that BTC may have just completed wave C of an ABC (red) corrective structure. In it, waves A and C had a ratio of 1:0.618, which is common in such structures.
If a bottom is not reached at the current level, the next most common ratio would be 1:1 at $12,100. This would be a drop of more than 60% when measuring from the current price.
So, just as the weekly tally suggests, a decisive breakdown below the current low would likely mean that BTC is in an extended bear market.