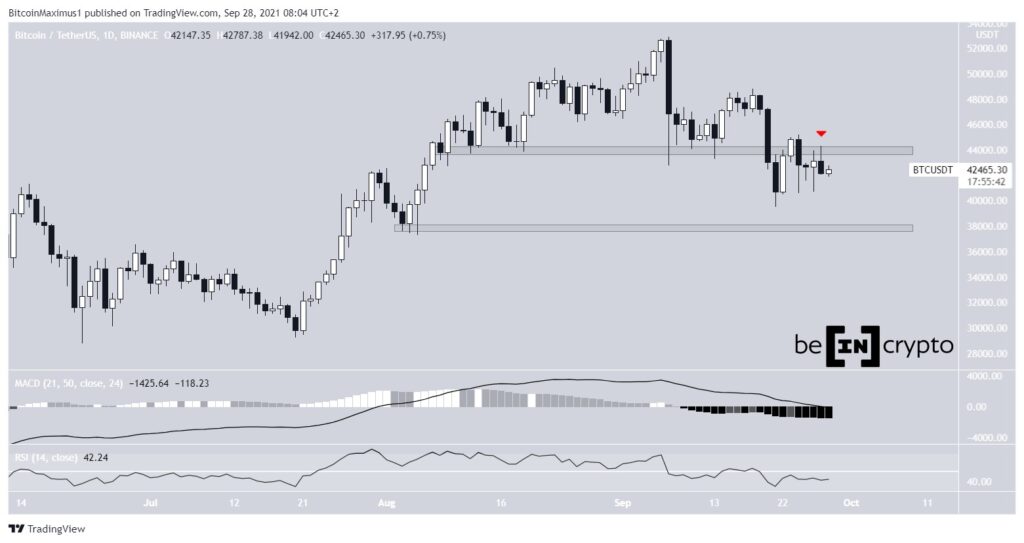
Bitcoin (BTC) attempted to move upwards on Sept 27 but was rejected by the $44,000 resistance area.
While BTC is still trading at the top of a descending parallel channel, the price action lacks bullish signals.
BTC is rejected
On Sept 27, BTC made an attempt at moving above the $44,000 area but was promptly rejected (red icon). The area had served as support in August and early September but turned into resistance after the September 20 breakout. The rejection created an upper wick and a bearish candlestick.
In addition to trading below resistance, BTC technical indicators have turned bearish as the RSI and MACD are falling. The MACD has just crossed into negative territory while the RSI is below 50.
If BTC were to continue to fall, the next closest support area would be at $ 38,000.
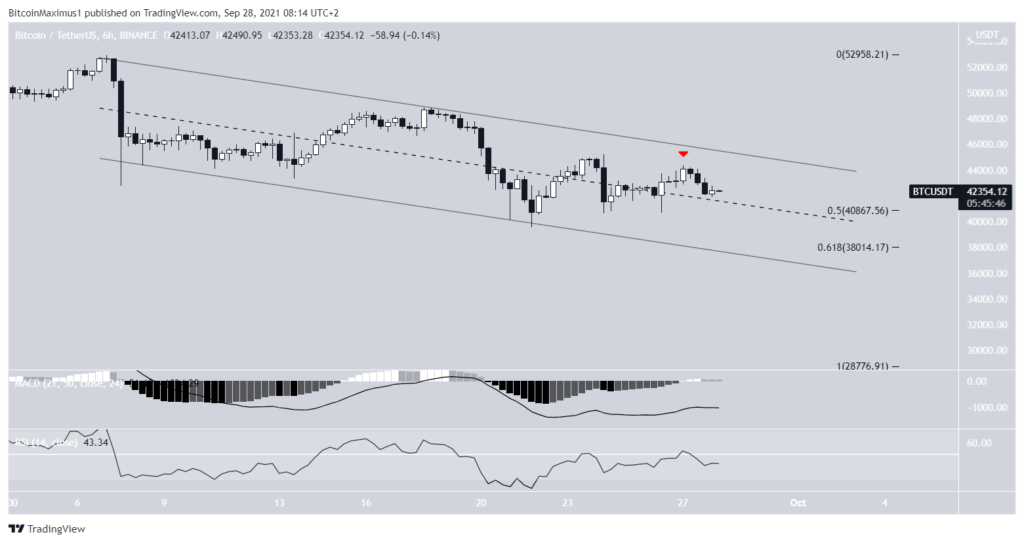
Current Channel
The six-hour chart shows a descending parallel channel, which usually contains corrective structures.
Currently, BTC is trading at its upper end. Additionally, it is trading just above the 0.5 Fib retracement support level.
Despite being above a confluence of support levels, technical indicators are bearish/undecided. The MACD is negative and has lost some strength as the RSI has just fallen below 50.
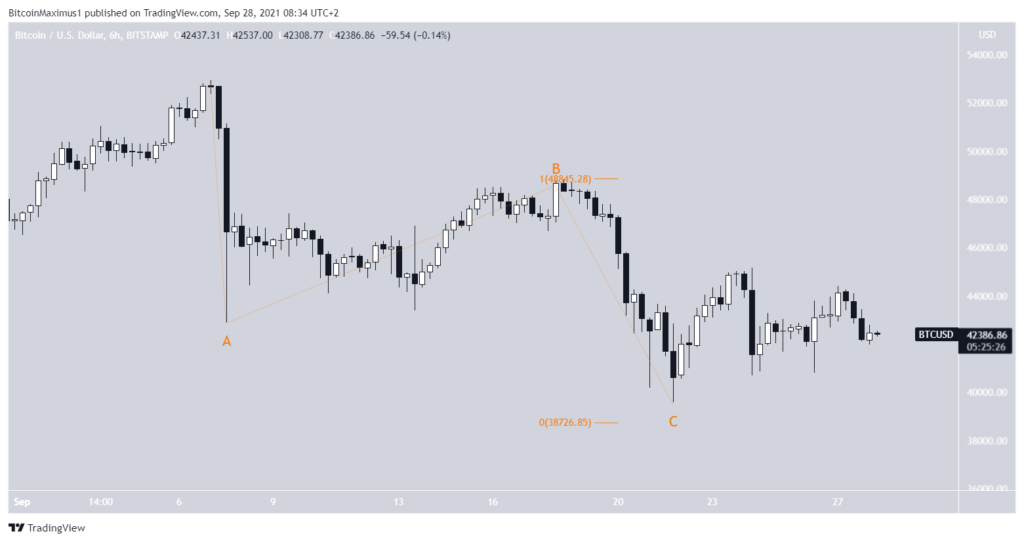
The two-hour chart shows that BTC is following an ascending support line and has made three higher lows since Sept 21. While this can be seen as a bullish structure, the price action is not bullish.
The previous resistance area at $43,000 that was expected to act as support did not. On the contrary, BTC fell through it. Additionally, the MACD and RSI turned bearish.
While there is very strong support at $41,500, created by the 0.786 Fib retracement support level and the ascending support line, the price action does not seem bullish.

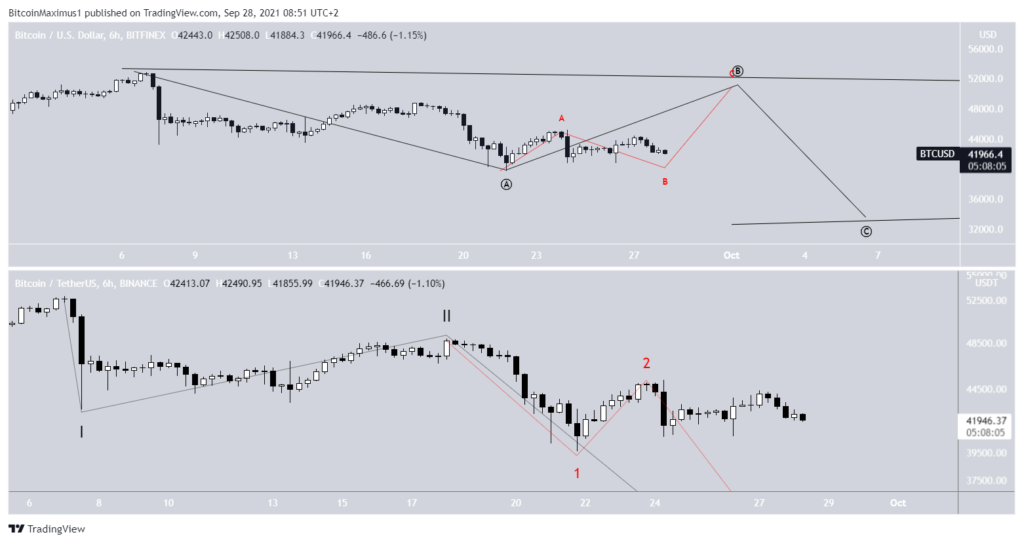
Number of waves
The most likely wave count still indicates that the decrease from September 7 to 21 was part of an ABC corrective structure, in which the A: C waves had an exact 1: 1 ratio. This is also supported by the presence of the descending parallel channel.
However, the move from the low does not seem impulsive, casting doubt on the possibility that this was the correct count.
Alternative counts could see the movement as a flat A-B-C corrective structure (upper image), or in the more bearish case a 1/2-/1-2 wave structure (lower image).
At present, the correct number cannot be determined.