Bitcoin (BTC) has not breached the resistance zone of $ 44,000, but is trading inside a short-term descending parallel channel.
While there are short-term bullish signs in place, the longer-term readings indicate that the trend is likely bearish.
Bitcoin regains footing
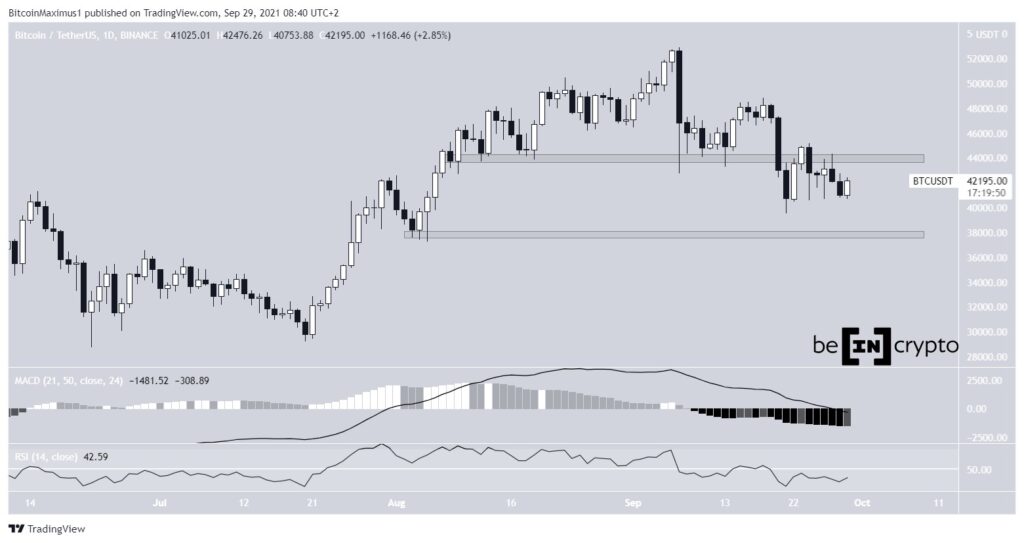
On Sept 27, BTC was rejected by the $44,000 resistance area, creating a long upper wick and a bearish candlestick. It was followed by another decrease the next day.
However, it seems to have regained its footing on Sept 29 and is in the process of creating a bullish candlestick.
It is currently trading near the $ 42,000 support area created by the wick from September 27.
However, technical indicators are still bearish since the MACD and RSI are both moving downwards.
Therefore, until the $ 44,000 area is recovered, the trend cannot be considered bullish.
The closest support is found at $38,000.
Parallel channel
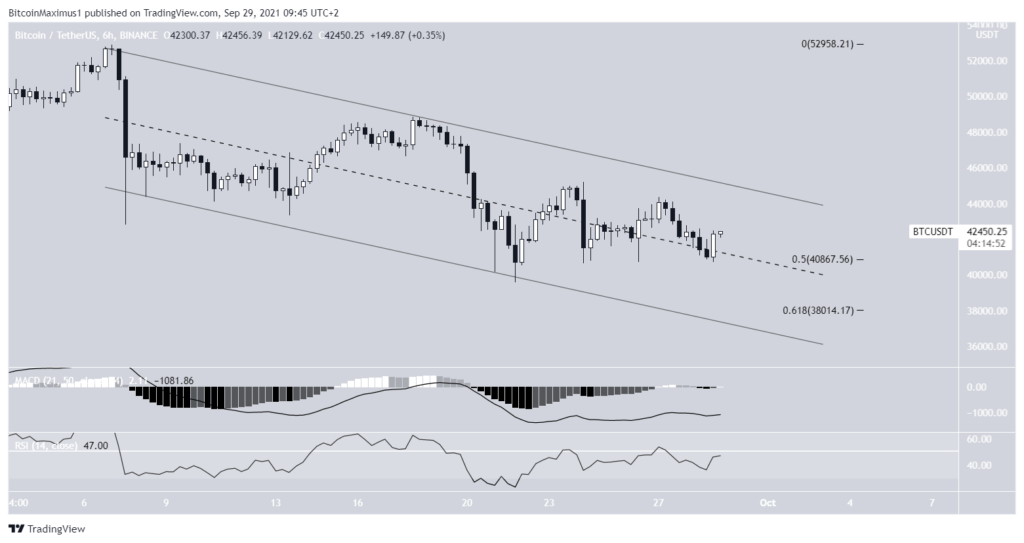
The six hour chart shows that BTC is still trading in a descending parallel channel. Such channels often contain corrective structures.
Additionally, it is trading in the upper part of this parallel channel after rebounding to the 0.5 Fib retracement support level. In addition to this, both the MACD and RSI are moving upwards. Therefore, the six hour reading still indicates that a breakout would be the most likely scenario.
The two-hour chart is consistent with this assessment. It shows that BTC is following an ascending support line and bounced from it for the third time yesterday.
Additionally, RSI and MACD are moving higher and the former is breaking above 50.
If BTC manages to clear the $43,000 resistance area, which is the 0.5 Fib retracement resistance level and a horizontal area, it would mean that a breakout from the channel should follow.

Wave count
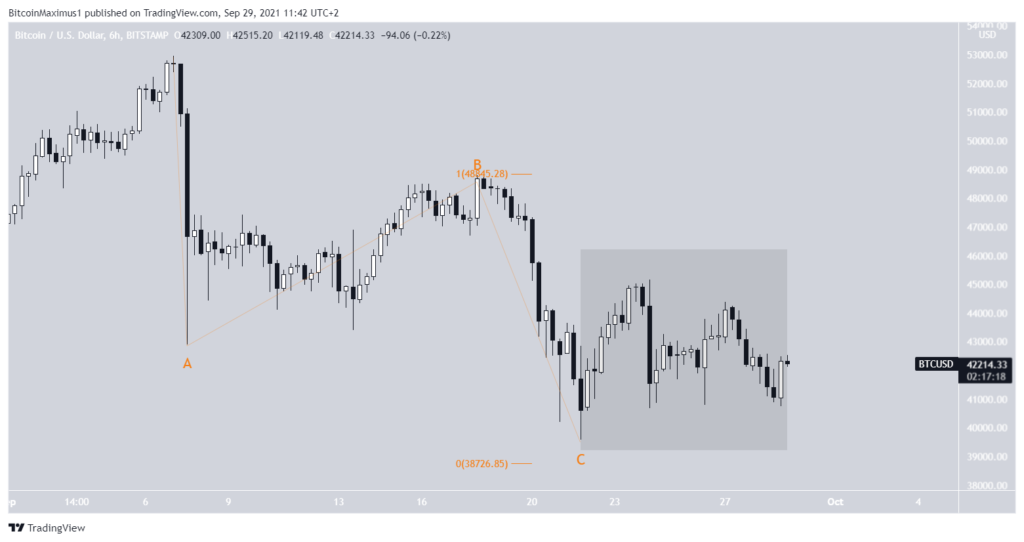
The most likely wave count would suggest that the decrease from September 7 to 21 was a completed ABC corrective structure. If so, the A: C waves had a ratio very close to 1: 1.
However, the ensuing bounce (highlighted) does not look impulsive. Therefore, this casts doubt on the possibility that this is the correct count.
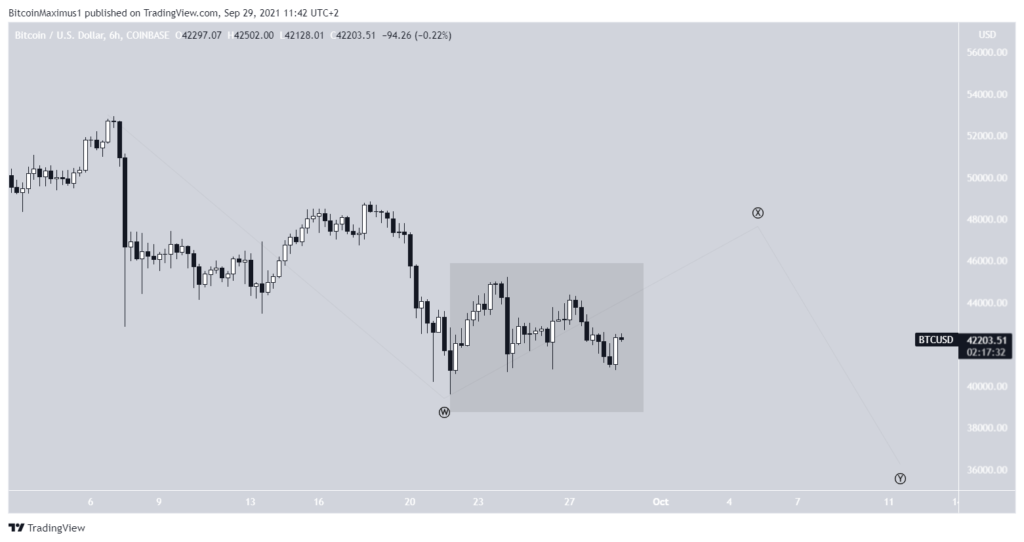
Another tally may be that the entire decrease was part of a W wave, indicating that BTC is in a complex corrective structure and is currently ending wave X.
The possibility of this being a 1-2/1-2 wave formation is there but currently seems unlikely.
Therefore, at present, the number of waves cannot be accurately determined.
However, the most likely counts both point to a short-term increase, even if the longer-term movement differs considerably.