Bitcoin (BTC) has moved above its September highs and is approaching the final resistance area prior to its all-time high. BTC could potentially be rejected in the short term before reaching a new all-time high. However, all signs point to a high being reached soon.
Bitcoin rose significantly on October 6, posting its largest increase since the upward movement began on July 21.
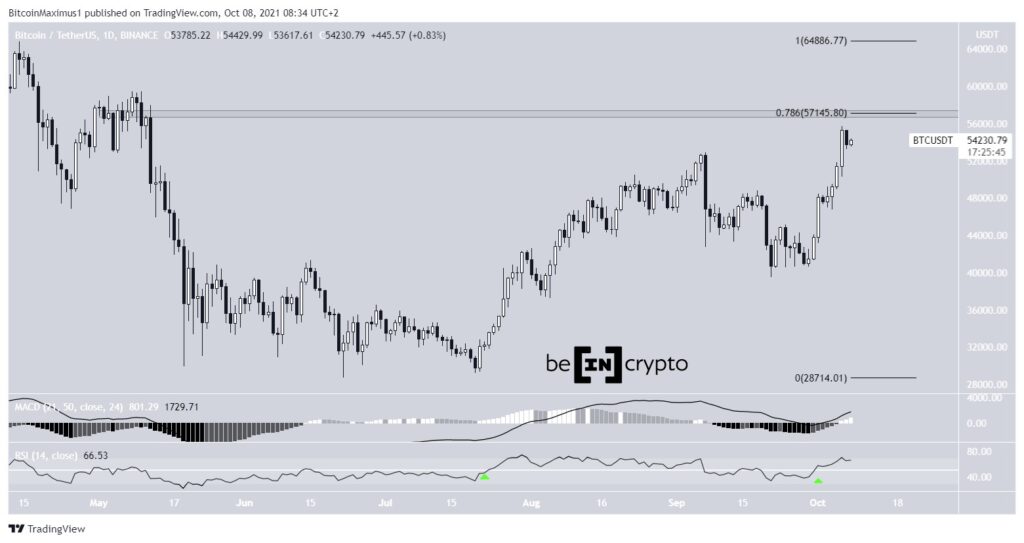
It’s rapidly approaching the closest resistance area at $57,200. This is a horizontal and Fib resistance level, which means it is an area of very strong resistance due to the confluence. A movement above would pave the road to the $64,640 all-time high price.
The RSI and MACD are bullish and increasing. The increase is especially important in the RSI since it caused a move above 50 (green icon). The previous time it happened on July 21, just before the current rally.
Also, the MACD is positive and increasing, which means that the short-term trend is increasing at a faster rate than the long-term trend
So the technical indicators in the daily time frame are clearly bullish.
Future movement
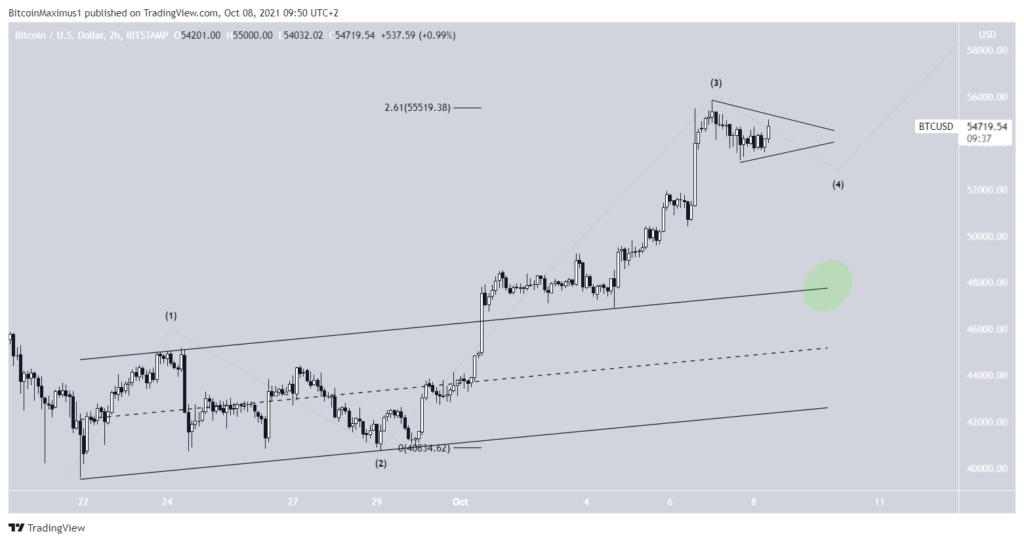
The wave count also supports the continuation of the upward movement. Since BTC exited an ascending parallel channel, it showed that the rally is part of a bullish momentum. This means that the trend is bullish, and the previous decrease was only a correction.
The most likely count indicates that the breakout was part of the third wave of a five wave bullish move. The reason for this is that wave three is most often the sharpest and longest out of the five waves.
Therefore, BTC is currently in the fourth wave. There are two main possibilities for its movement.
The first is a sideways pattern, in which BTC consolidates into a channel or triangle before finally breaking out. Currently, this seems like the most likely outlook.
The second possibility is that BTC will complete a fourth wave pullback before going up. This means that a sharp drop will complete wave four prior to the continuation of the upward move.
If this happens, the resistance line of the previous channel at $ 48,000 would be a likely level for the correction to end.
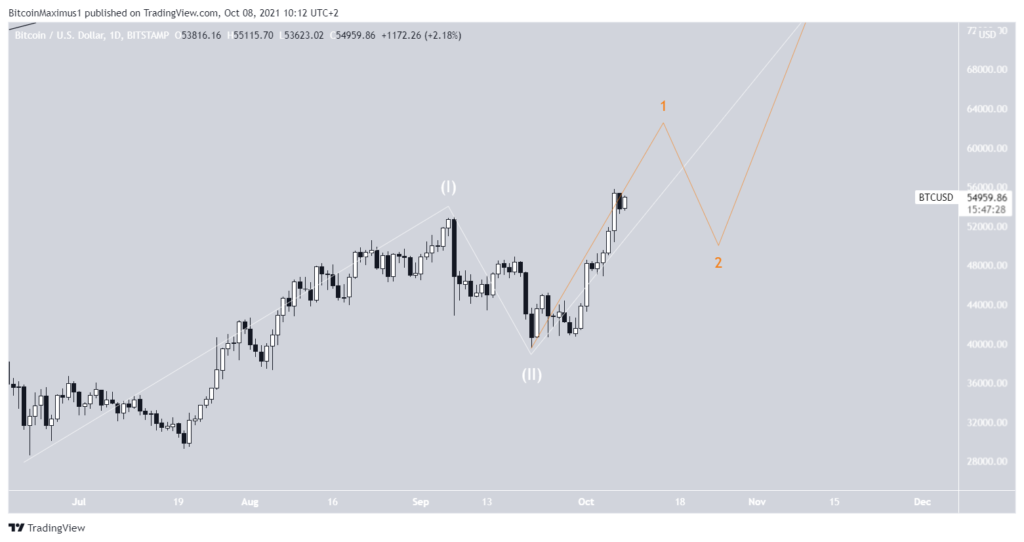
The long-term wave count provides a very bullish outlook, indicating that BTC will soon hit a new all-time high.
Most likely, BTC is in a 1-2/1-2 wave formation. In this case, it is now only in the first part of the bullish movement (orange) that will accelerate considerably.
The potential decrease in sub-wave two (orange) would allow altcoins to outperform BTC. Once BTC gets closer to a new all-time high, altcoins will likely be lagging behind.