
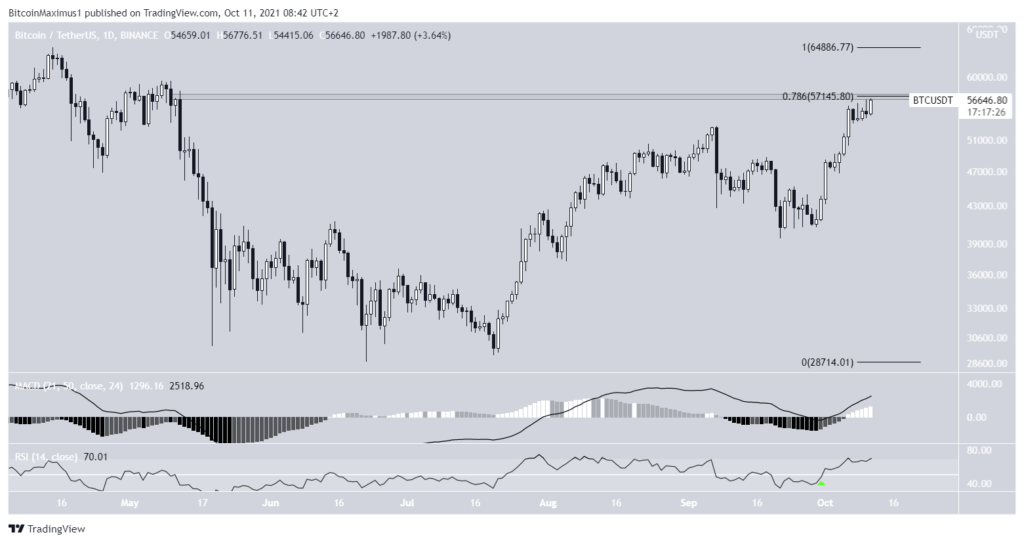
Bitcoin (BTC) created another bullish candlestick over the weekly period, continuing its continued ascent towards a new all-time high. BTC is expected to break above the resistance level of $ 57,150, which is the last before the all-time high.
The weekly bitcoin chart is shifting toward a bullish outlook. This happened mainly due to technical indicator readings rather than price action.
Firstly, the Supertrend line has turned positive. Supertrend is an indicator that uses absolute highs and lows to determine the direction of the trend. If the price of BTC is above the indicator line, the Supertrend is considered bullish. Since BTC just moved above the Supertrend resistance line (green circle), the indicator has turned bullish.
On top of that, the RSI and MACD are bullish.
The RSI, which is an indicator used to measure momentum, has moved above the 50-line (green icon). This usually means that the trend is bullish and ends a 77 day period in which the indicator was below 50. The previous time the RSI crossed above 50 was in April 2020, preceding the rally to $64,000.
The MACD, which is created by both short and long term moving averages (MA), is positive and is moving upward. Furthermore, its histogram is almost positive. This means that the short term trend is moving faster than the long term trend.
While BTC has yet to reclaim the ascending support line from which it previously broke down, the indicator readings. counteract the relatively bearish price action.

Ongoing bitcoin breakout
The outlook from the daily chart is in alignment with that from the weekly chart, showing similar RSI, MACD, and Supertrend readings.
On top of that, the price action is bullish in this time frame.
BTC is in the process of creating a bullish candlestick inside the wick from Oct 10. This is a sign that the selling pressure is dissipating.
Furthermore, BTC is approaching the $57,150 resistance. This is both the 0.786 Fib retracement level and a horizontal resistance area.
If a breakout occurs, BTC should have little in the way to stop it from increasing toward its all-time high price.
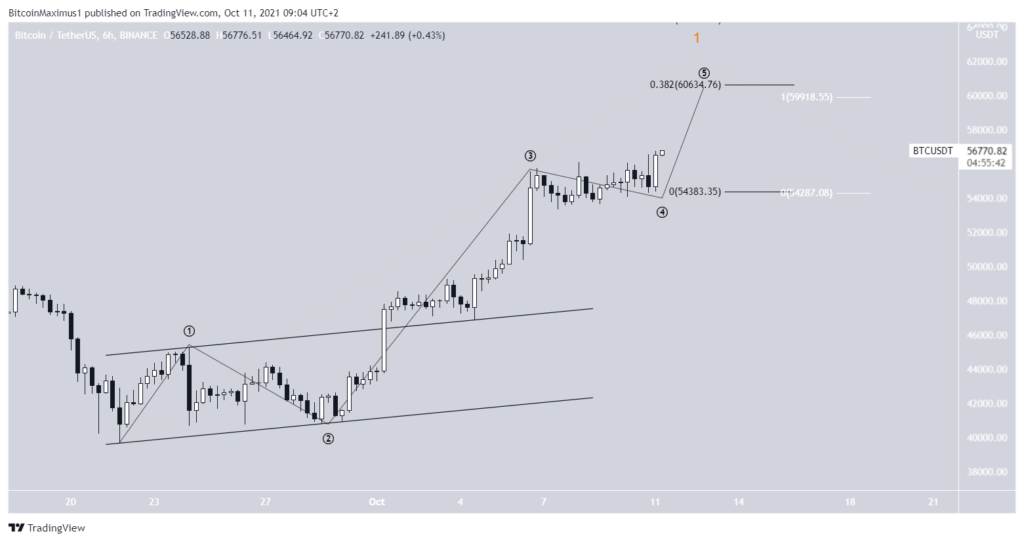
The six hour chart also gives a bullish outlook. Firstly, it shows a breakout from an ascending parallel channel, a sign that the trend is bullish and the previous correction has come to an end.
On top of that, as BTC consolidated below the resistance zone of $ 57,150, the RSI generated a hidden bullish divergence. This is a strong sign of trend continuation. Therefore, a breakout would be the most likely scenario.
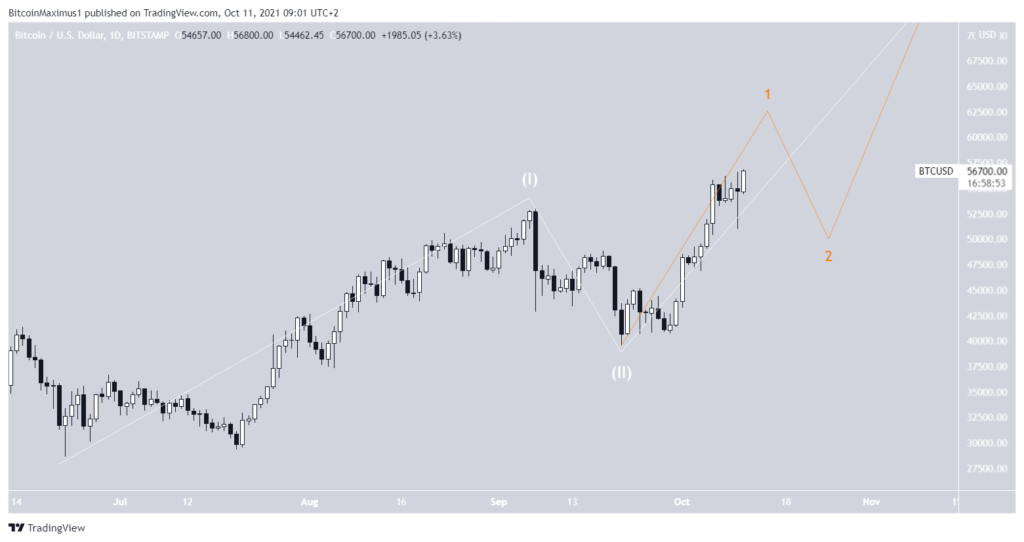
Number of waves
Finally, the number of long-term waves is bullish. It indicates that BTC is currently in a 1-2/1-2 wave formation. This means that the current rise is only the first part of the bullish movement, which will accelerate considerably thereafter.
Secondly, the short-term count shows that BTC is in the fifth and final sub-wave of the current increase.
The most likely target for the top is between $ 59,900 and $ 60,650. This target range is found using the length of wave one (white) and the lengths of waves 1-3 (black).