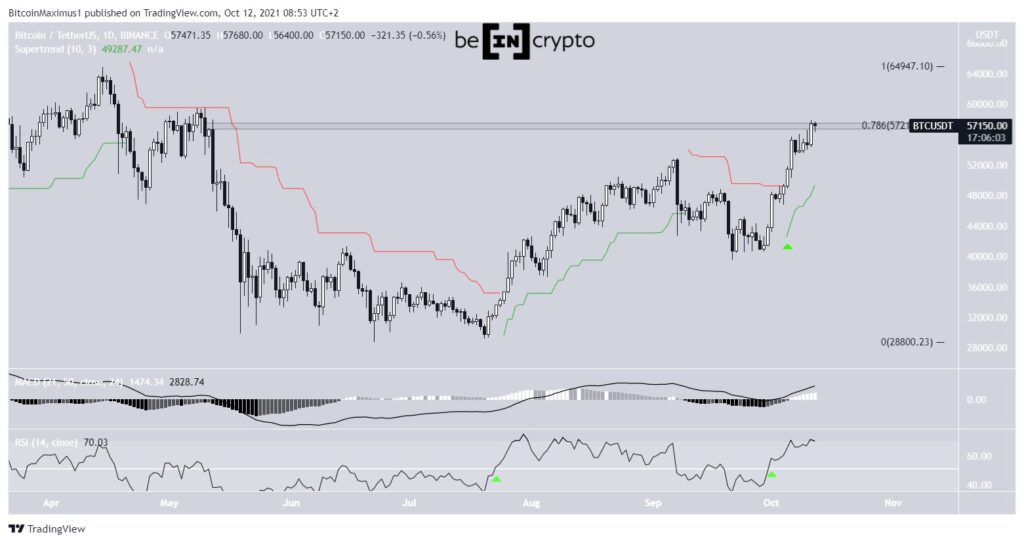
Bitcoin (BTC) is making its first attempt to break above the resistance zone of $ 57,200. If successful, it could test the highs reached back in April and May of this year.
A breakout could bring BTC back to the $ 60,000 level and could potentially lead to a new all-time high.
Bitcoin attempts breaking above resistance
BTC increased considerably on Oct 11, creating a large bullish candlestick, which took it inside the $57,200 resistance. This is the 0.786 Fib retracement resistance level and it is the last horizontal area before the all-time highest price.
The fact that BTC managed to close well inside this resistance area is a bullish occurrence, since the upward movement was sustained due to sellers not being able to push the price down.
On top of that, the daily horizon technical indicators are firmly bullish.
Firstly, the RSI has moved above the 50-line. Crosses above and below this line are used as a basis for the direction of the trend. The previous cross above this line led to a nearly two-month bullish move.
Secondly, the MACD is positive and increasing. This indicator is created using a combination of short and long term moving averages (MA). The fact that it’s positive and increasing shows that the short-term trend is moving quicker than the long-term trend.
Third, the Supertrend line is bullish (green icon). Supertrend is an indicator that uses absolute highs and lows to determine the direction of the trend. If the BTC price is higher than the indicator line, the Supertrend is considered to be bullish. Since BTC just crossed above the Supertrend resistance line (green circle), the indicator has turned bullish.
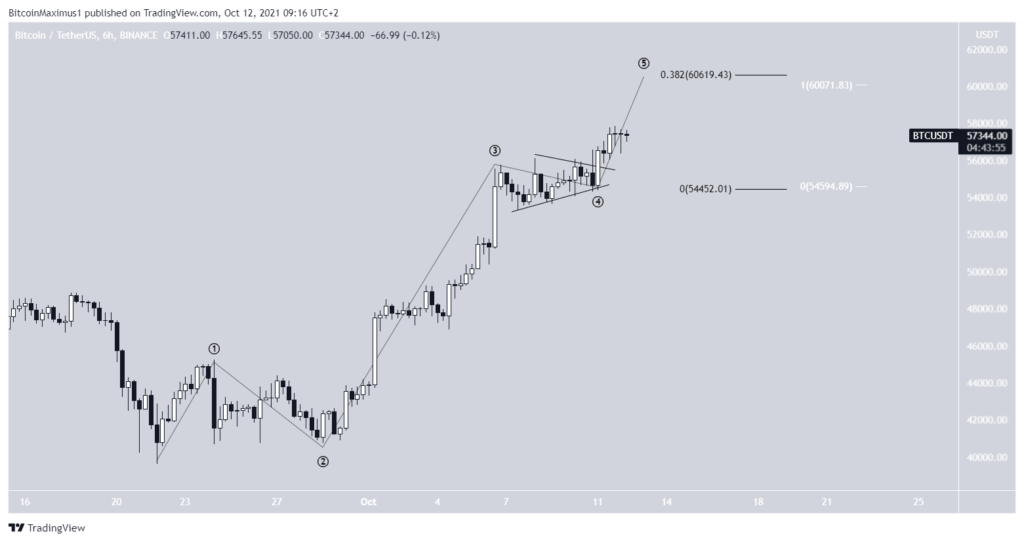
Wave count
The RSI has generated a hidden bullish divergence. This is seen as a strong sign of trend continuation. Unsurprisingly, BTC resumed its bullish movement immediately after the event.

The wave count also supports the continuation of the upward trend. This shows that BTC is in the fifth and final wave of a bullish impulse. This means that while the trend is bullish, BTC is likely in the final portion of its increase.
Wave four had a triangular shape, which is most common for such waves, further reinforcing the possibility that this was the correct number.
The most likely target for the top of the move is found between $60,000-$60,600. This target range is found using the 0.382 Fib length of waves 1-3 (black) and the 1: 1 length of wave one (white).