Bitcoin (BTC) increased considerably during the week of Oct 11-17, advancing close to a new all-time high price. While the trend is still bullish, BTC appears to be approaching the top of its short-term bullish movement.
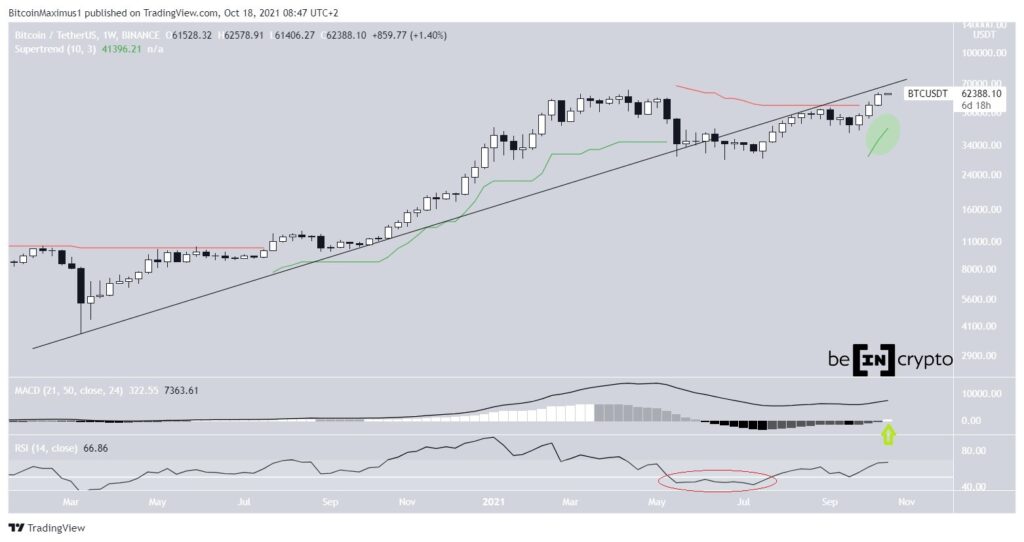
The weekly Bitcoin chart shows a mostly bullish trend, which is most pronounced in technical indicators.
BTC still has not recovered an ascending support line from which it had previously broken. Until it does that, the price action cannot be considered bullish. The line is particularly important as it has followed price movements since the March 2020 low.
However, technical indicators paint a firmly bullish picture. First, the MACD is positive and increasing and is creating the first bullish histogram bar since early June (green icon). The MACD is created by a combination of short and long-term moving averages (MA). The reading means that the short term trend is moving faster than the long term trend.
The RSI is also above 50. The RSI is a momentum indicator, and the cross above 50 indicates that the trend is bullish. The last time the indicator broke above 50 was at the start of the bullish move in April 2020. In addition to this, the recent cross makes the previous decrease below 50 just a slight deviation (red circle).
Finally, the Supertrend is bullish. This indicator uses absolute high and low prices to determine the direction of the trend. Since the price of BTC is above the indicator line, the trend is considered bullish (green circle).
New Bitcoin all-time high on the horizon?
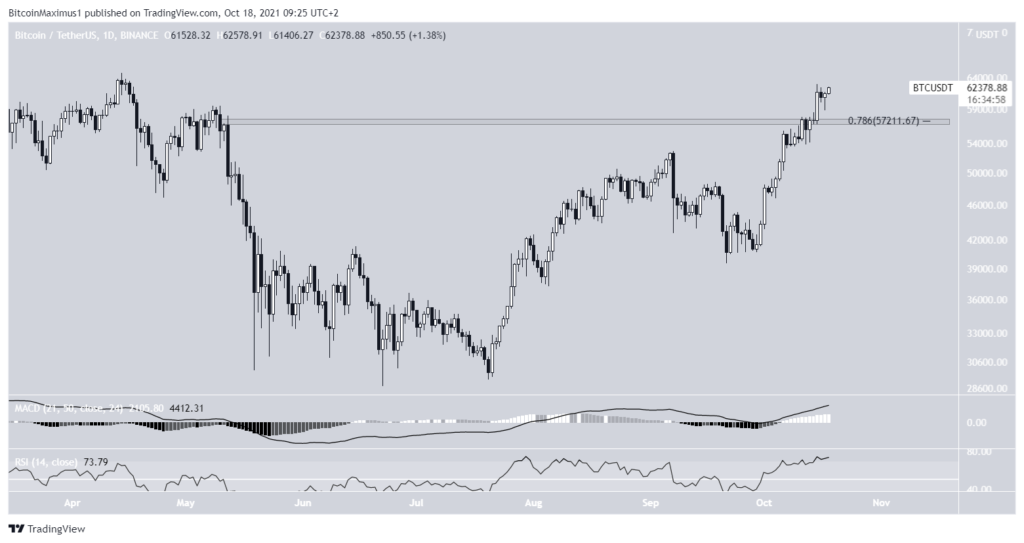
The daily chart provides a similarly bullish outlook. BTC broke above the resistance zone of $ 57,200 on October 14 and rose significantly the next day. This was the final resistance area prior to the current all-time high price of $64,854.
Similar to the weekly calendar, the technical indicators of the daily chart are also bullish. The MACD is positive and increasing and the RSI is also increasing and is above 70. Unlike the weekly chart, this shows a slightly overbought trend which is still bullish.
Short-term movement
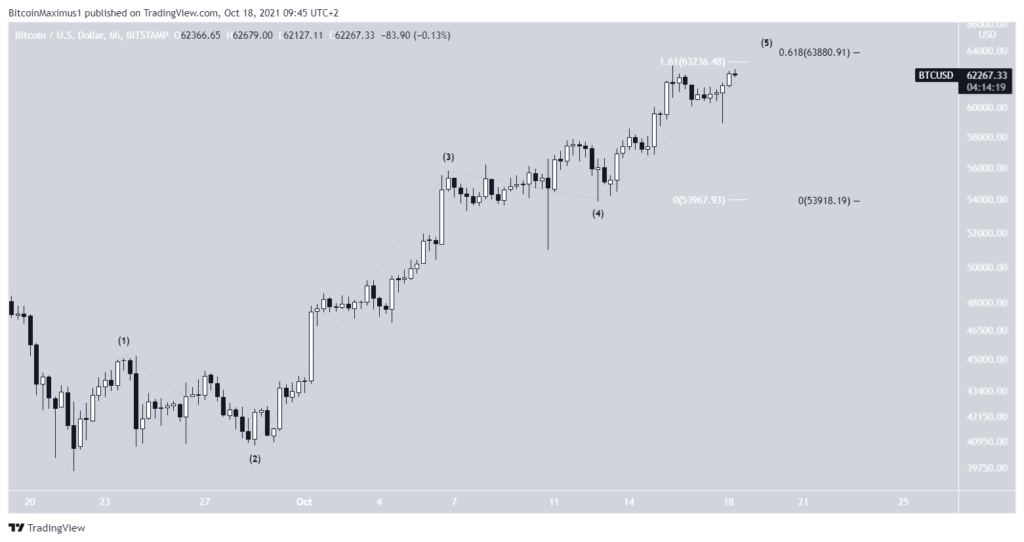
The short-term wave count shows that BTC is in the fifth and final wave of a bullish impulse. This means that once the movement is complete, a correction is expected. The number of long-term waves is also bullish.
The most likely target for the top of the upward move is found between $63,250 and $63,850. This target range is found using the 1.61 wave length (white) and the 0.618 wave length from waves 1-3 (black).