
As Bitcoin plunged below the $ 61,000 zone, Ethereum couldn’t hold out for long either. On the daily time frame, ETH traded at $4,177, noting an 11.54% daily price fall and 13.10% price loss on the weekly.
So, shortly after Ethereum saw its highest weekly closing price of $ 4643 (vs USD on Binance), how did the highest coin fall? Well, the signs of a short-term bearish price turnover could be spotted before the price slumped.
Unmissable signs
Firstly, Ethereum was seeing considerable consolidation after achieving an ATH of $ 4,868 on November 10. As the price candles on the daily chart closed in red for almost a week, ETH’s supply on exchanges also witnessed some sudden moves.
On November 14, just days before losses of more than 10% hit the top altcoin, more than 100,000 Ethereum (nearly $ 450 million) were removed from trading.
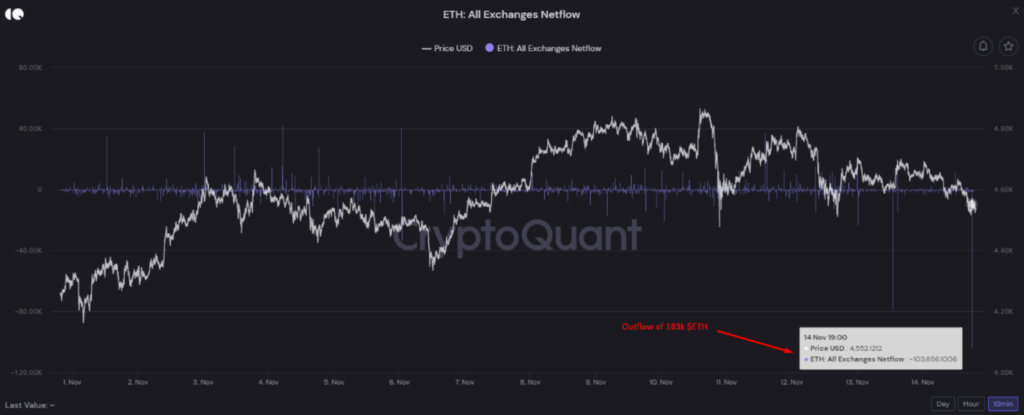
Post this large withdrawal, the same could be interpreted in two ways. One a long term bullish outlook and the other a short term bearish scenario that can pretty much be seen now. The former scenario shows that there is demand for ETH from the bigger players at current price levels, which was a good sign.
The first scenario could be inferred keeping in mind that there is a whale that has finished buying at the moment, which means that if the purchasing power goes down, a decrease in prices in the short term could occur. ‘follow.
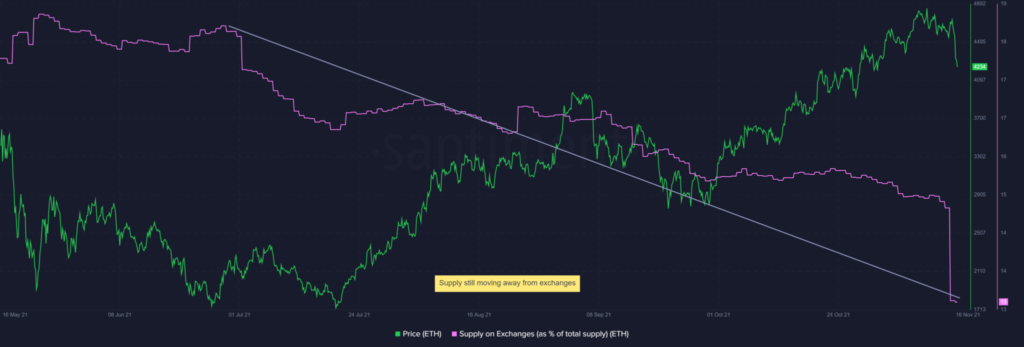
However, keeping the larger picture in mind, it could be noted that Ethereum’s supply on exchanges sat at 13% and saw a sharp fall alongside dropping prices. A year ago, that number stood at 23.29%, and the almost 50% drop in that number indicates that ETH is safely moving to cold wallets for DeFi and HODLing related activities.
So, what’s ETH’s near-term fate?
While there are some long-term bullish signs, there are persistent fears that ETH could retest the $4K mark as it tested the $4100 mark on 16 November. However, recently Ethereum experienced one of its biggest dormant circulation days ever, with 1.82 million ETH mobile addresses for the first time in five years.
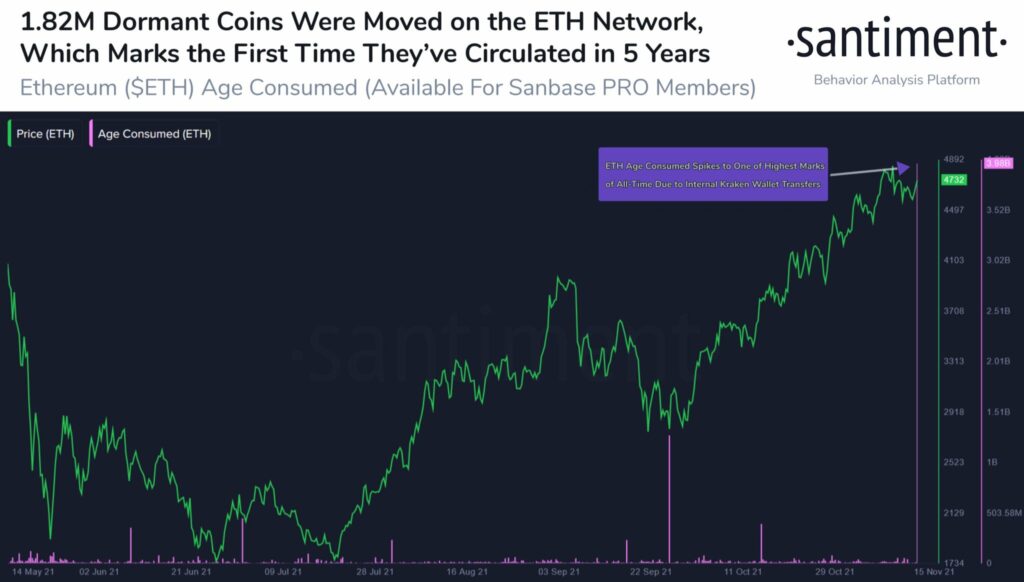
While this move could further cause subsequent price drops in the near future, as reported by Santiment, there wasn’t much to worry about. It looked like the ETH move was most likely due to internal transfers between Kraken wallets and wouldn’t cause strong selling pressure, at least for now.
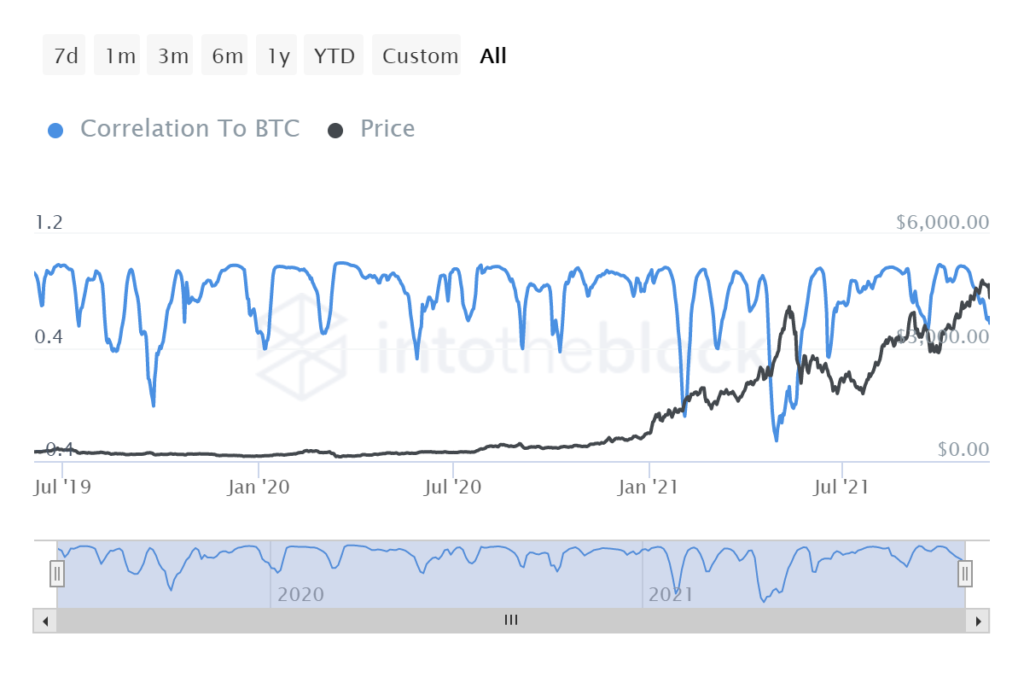
Furthermore, ETH’s correlation to BTC was heading for all-time low levels even though the two top coins took a tumble together. As seen below, the previously low correlation levels of all time have been good for the price of ETH, as seen in late April and June.
For now, however, as Bitcoin continued to fall the larger market looked weak, in terms of price. Ethereum’s price also appeared to be trending down, with the coin’s daily RSI falling almost vertically. Additionally, ETH’s price on a daily also fell below the MA 20, this will be a crucial level to watch in the near future and a move above the same could ensure recovery.