Less than two weeks ago, the global crypto market had passed the $ 3 trillion capitalization mark. Due to the recent uproar, however, the aforementioned level could not be maintained for long. After noting a 6% dip in just the past 24-hours, the market cap reflected a value of $2.47 trillion, at the time of this analysis.
The highlighted downtrend was led by large cap cryptos. Over the past seven days, all of the top 10 coins have lost value in the 14% to 20% range, with Ethereum being no exception.
Financial astrology
During times of uncertainty, people rely on foretellers to predict the future course of action. Given that the market is currently at an undecided turning point, let’s dive into the magic of metrics to help us gauge the future of Ethereum.
In a recent article it was highlighted that financial astrology is nothing but mathematical psychology based on the science of astronomy. Frankly speaking, this measures general market sentiment. Well, no celestial object better than the moon to help us with that.
Assets usually tend to perform well during a particular lunar phase and are more prone to downfalls during the other. The phases of the moon are largely reliable, but not always very precise.
TradingView’s Moon Phases indicator displays moon phases on the chart. A dark circle usually indicates a full moon while a bright circle represents a new moon. The bars between solid and new moons are colored accordingly – either growing or declining.
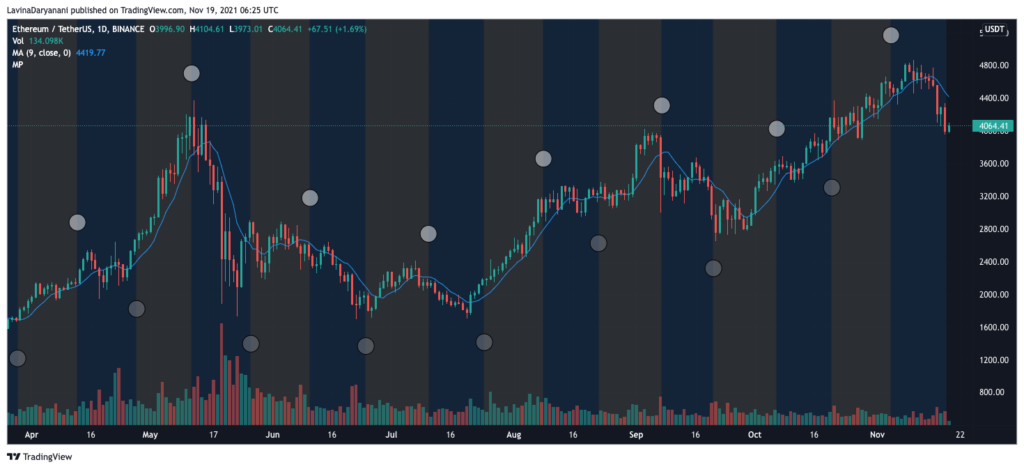
If the chart is viewed closely, an interesting pattern can be deciphered. The fortnight following any bright-white circle depicted on the chart have more often than not been bearish. Correspondingly, whenever the price of Ethereum entered the yellow spots on the chart, the price has mostly seen a rally.
Having observed the way things have panned out in the recent past, market participants can expect some action to unfold soon. November 19 is a full moon day and the price of Ethereum is expected to enter the “growth” phase. In fact, at the time of writing the up-and-coming candle was green and Ethereum was trading very close to its daily high.
Now, before breathing a sigh of relief, it is equally important to consider other trends, especially that of market participants.
Evaluate the sentiment of traders
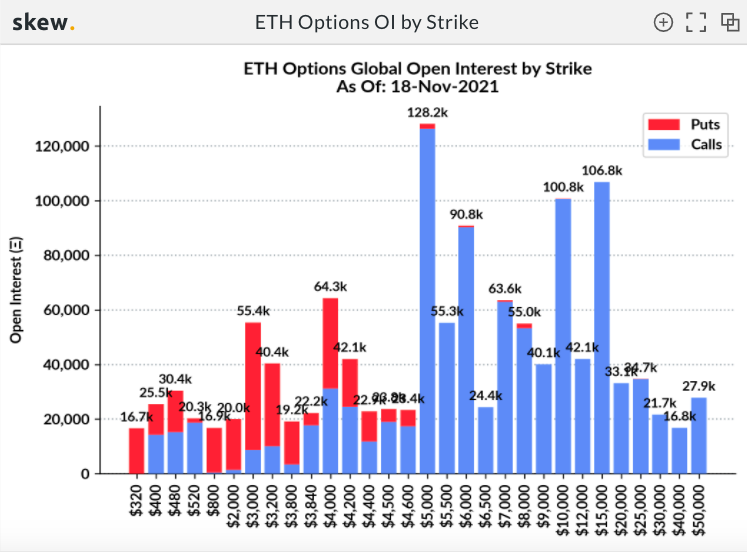
The Ethereum options market is expected to experience a significant expiration involving 132.4k ETH on November 19. As seen from the chart attached below, calls [buy contracts] do have the upper hand, but the puts [sell contracts] aren’t too far behind.

Puts predominantly dominate proceedings in the lower price range up to $ 4.4,000 and calls clearly have a say in the upper ranges. So, at the time of expiry, if Ethereum continues to revolve around its press time $4k region, bearish sentiment would end up gaining even more steam.
However, if the larger alt manages to appreciate and break above $ 4.4,000, call owners would be incentivized to use their ETH call option. In effect, this could help in flipping the on-going bearish narrative.
Given the pessimistic sentiment in the market, it would be interesting to see if the magic of the moon can help Ethereum cross $ 4.5,000 in the days to come.