Bitcoin’s price action continues to be fragile in the near term, but this could be largely attributed to headwinds caused by the new COVID variant.
Despite the recent bearishness, the on-chain metrics and the mid-to-long-term technicals continue to favor extended bull market and show no real signs of worry.
This analysis was carried out by analysts GrizzlyBTClover and CryptoVizArt To CryptoPotato.
Mid-Term Technical Analysis
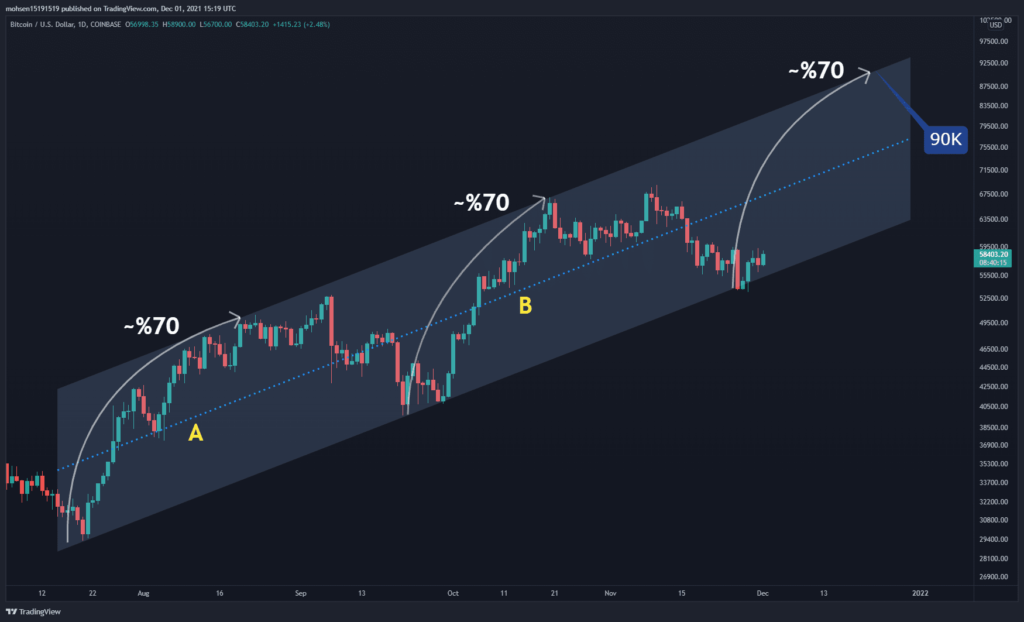
Bitcoin is moving up inside the uptrend channel on the daily timeframe, and the formation of higher highs and higher lows confirms its bullish bias.
With the recent bullish move (~ 70% of the bottom of the channel), the market has seen a 20-day correction. Considering the mentioned structure, the current bullish rally is expected to continue due to the difference between waves A and B. Wave A has moved with a gentler slope than wave B and has reached the top of the channel, while wave B moved with a steeper slope in a shorter time.
On the other hand, the red candles in wave B are weaker than wave A and the depth of the correction of wave B was less than wave A. These all point to a strong uptrend move. Assuming Bitcoin completes its last uptrend wave in the same manner as the past and moves towards the top of the channel, BTC prices may reach 90K.
Short term technical analysis
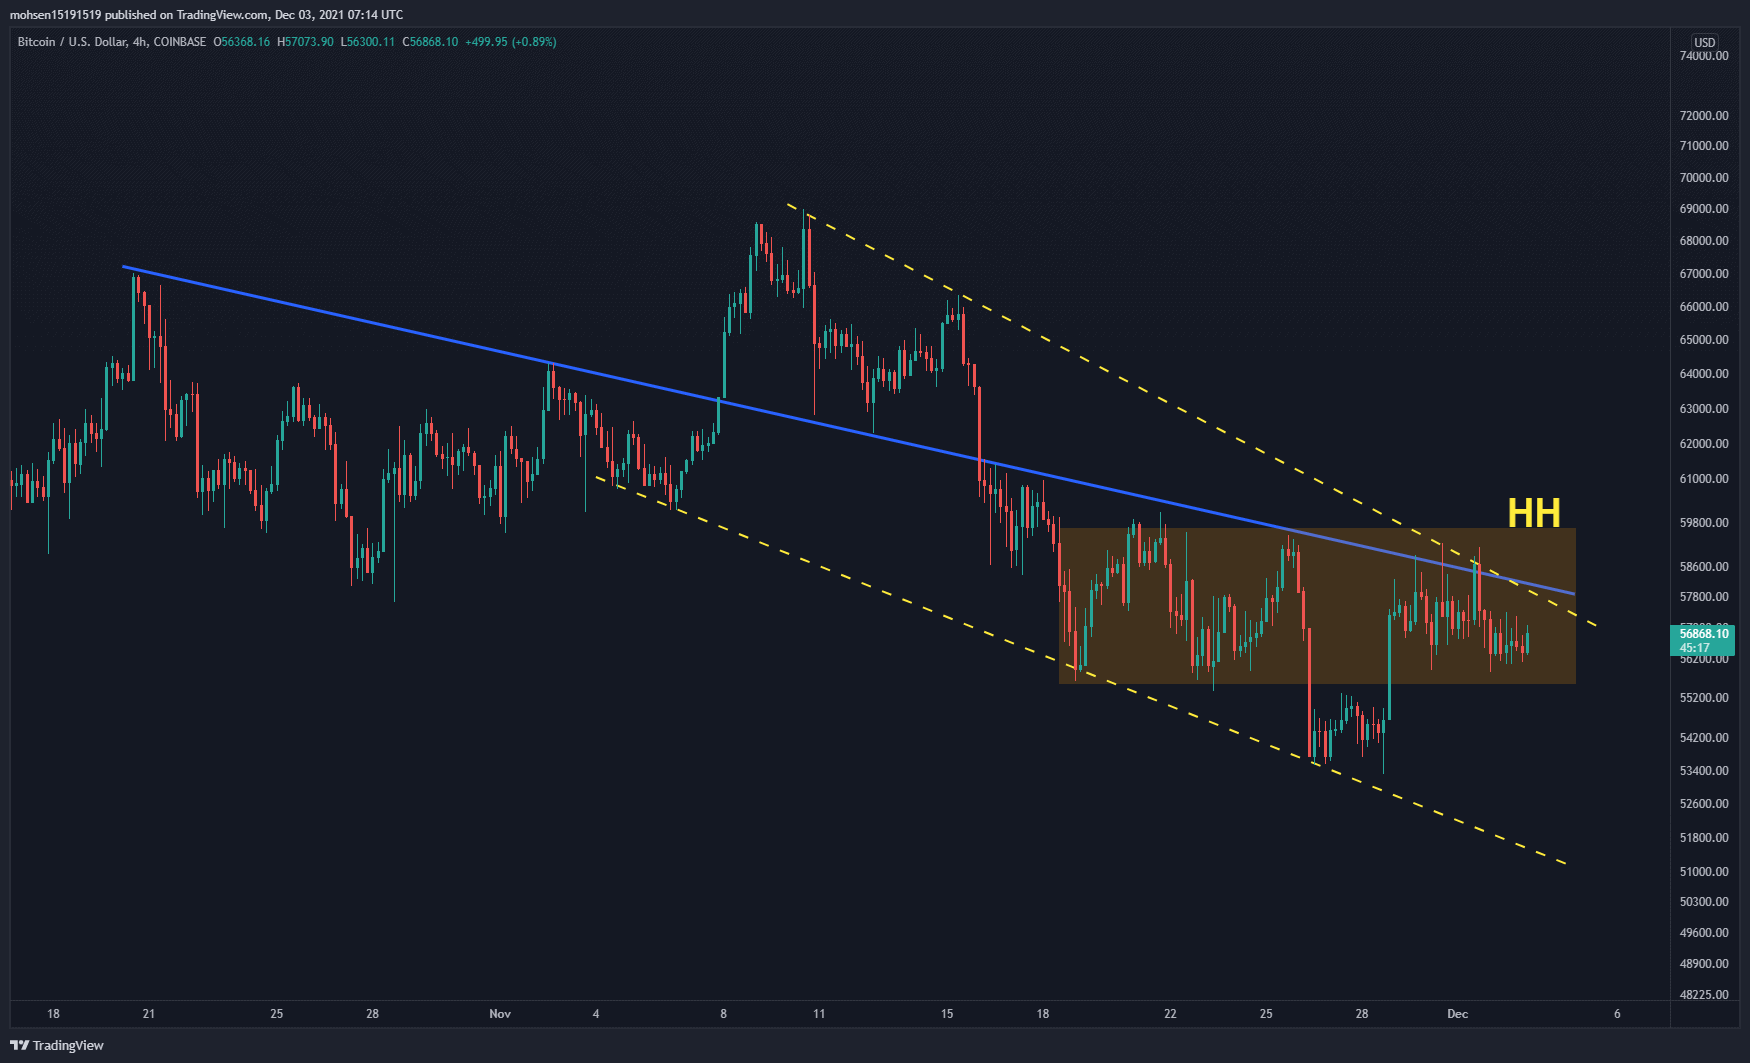
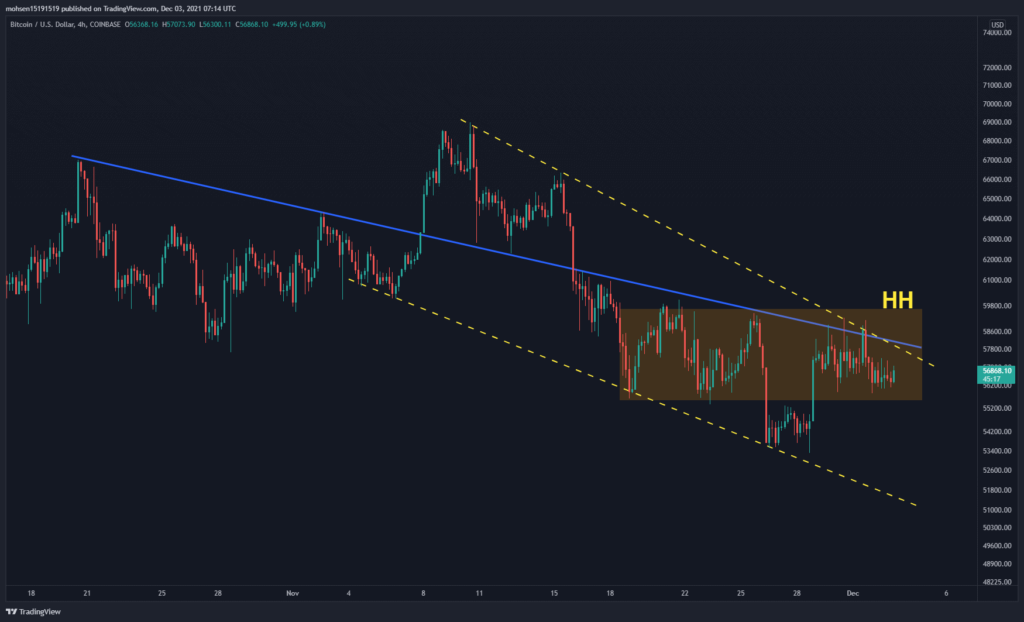
As a next step, it is important to look at shorter time frames to examine the dependence of the medium term trend. Price struggled with the downtrend line (blue line) and crossed it a few hours ago, but this breakout has yet to be confirmed (turned into a fake). A reversal movement is confirmed when the price crosses its short-term bearish trendline and forms a higher top.
As a result of the formation of a higher high at 60,000$, a continuation of the uptrend looks probable. Bearish selling pressure is indicated by upper shadows towards $60K on this timeframe. But, first, the bulls will have to break this line, and on the other hand, hold the next critical support level of $56K and the past week’s low at $53K.
Supply / demand analysis
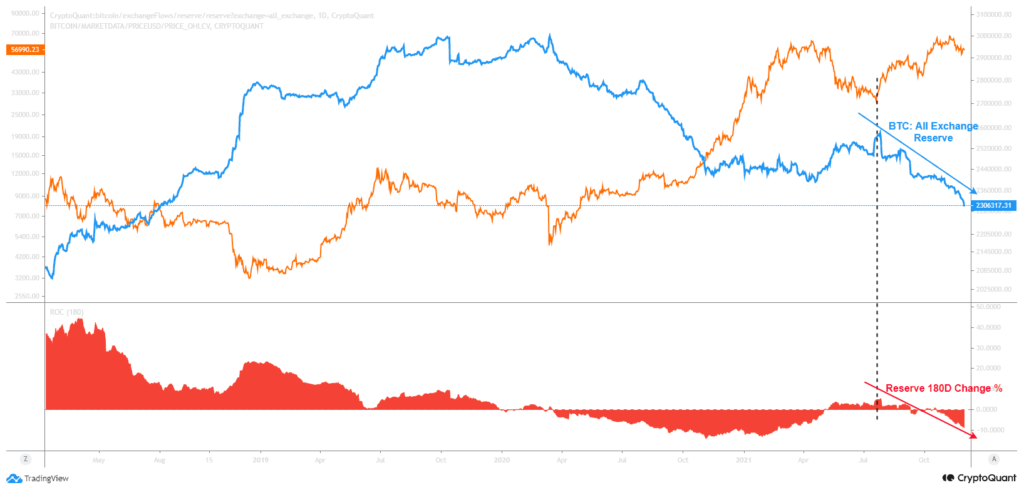
By looking at the rate of change of all foreign exchange reserves, it is possible to estimate the strength of supply and demand in the market.
As illustrated, the long-term trend confirms a continuous reserve depletion across all exchanges. The current declining trend started mid-July when the market bounced back from ~30K support level. Since then, the price action has been driven up by the supply shock.
Profit / Loss Realization: Was $ 69,000 the Peak of the Cycle?
The market was down 23% after registering the new ATH of $ 69,000 in late November. The main concern was whether this ATH was the top of the cycle.
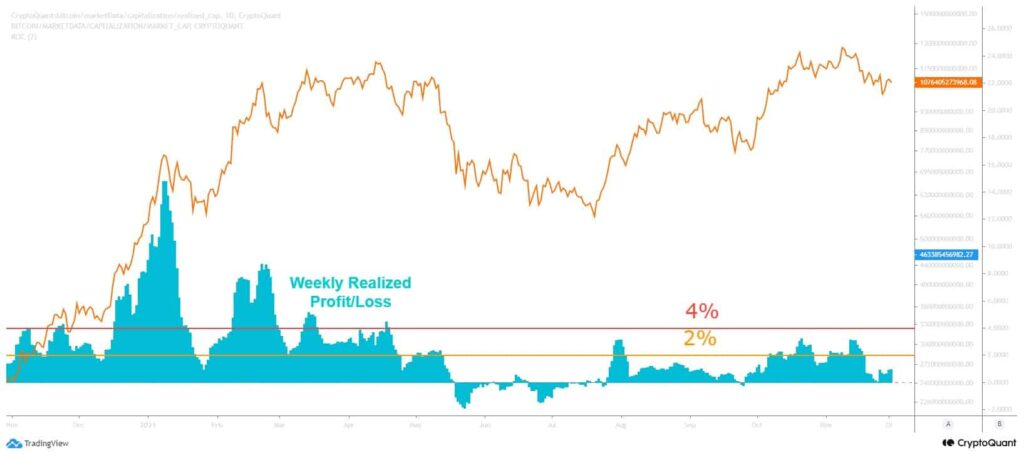
To shed some light, we can compare the intensity of profit realization at the new ATH in late November ($69K top) and the previous ATH in April ($64K). The image below presents the weekly profit/loss intensity as a percentage of the realized cap. The recent rally to the $69K has not experienced an intensive profit realization like 2021 Q1.
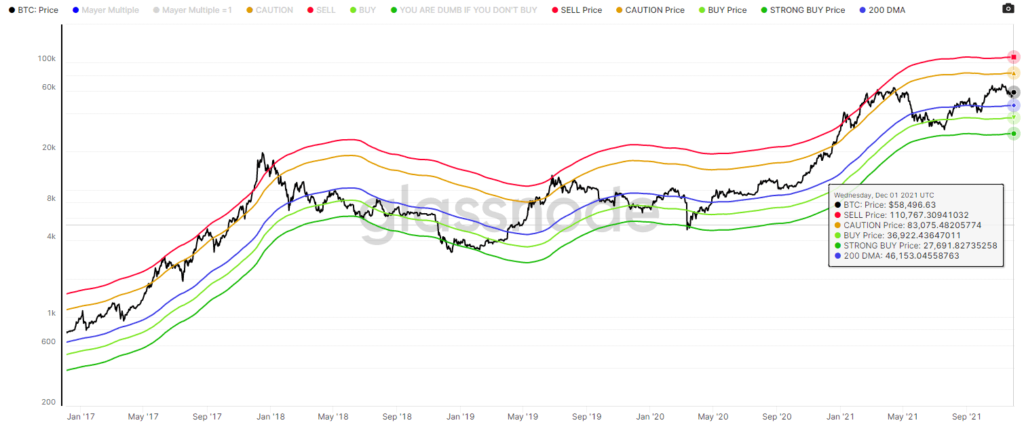
Risk analysis
Mayer’s multiple is a multiple of the 200-day moving average and the price. This metric uses historical price values and estimates whether the market price is statistically overheated, fair, or undervalued. The current price is slightly above its 200-MA ($ 46,000) and in the low risk area. Based on the existing market structure, the high risk area is between ~ $ 80 and $ 110,000.