
Bitcoin and Ethereum have dropped the ball. The market has been witnessing a decline matched by the correction intensity from 19 May, 2021. Needless to say, that the long-term bullish structure is currently fractured. In recent articles, we highlighted the possible bullish scenarios for Bitcoin but none of them panned out like expected. In this article, we will analyze the new on-chain developments and estimate if there is a buying opportunity in the market. Bitcoin and Ethereum are respectively down by 11% and 8% at press time.
Bitcoin barely held the first on-chain medium
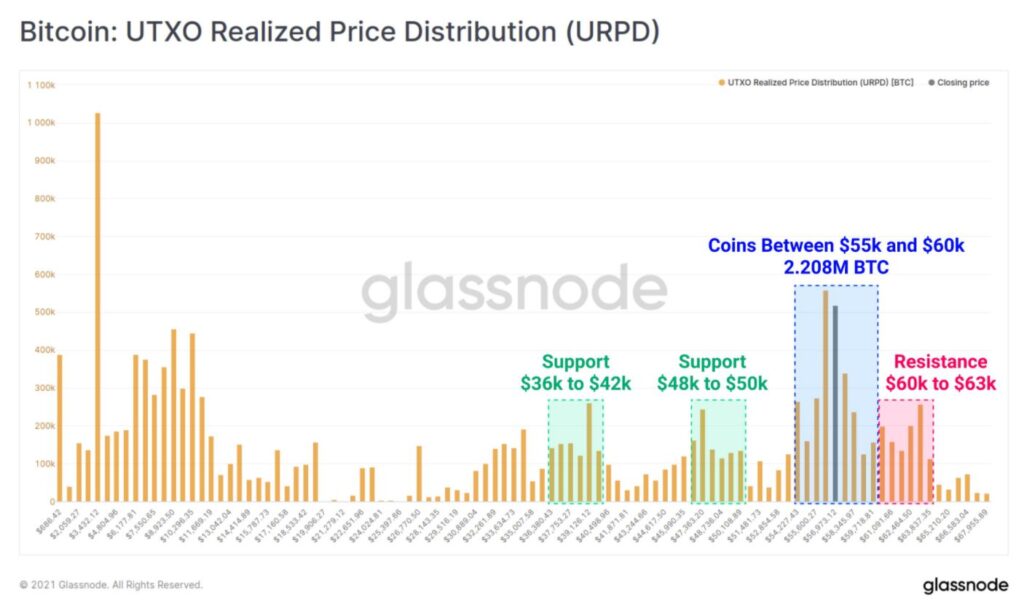
Less than 48 hours ago, Bitcoin was consolidating in a range between $ 55,000 and $ 60,000. The importance of this range was illustrated by the fact that it includes the highest BTC cluster, with over 2.2 million BTC moved in this range.
However, this particular range was hardly held by the digital asset, dropping down to as low as $42,000 in the chart. The asset currently remains under the next support range as well ( i.e. $48k-$50k) and the market structure indicates the price is yet to bottom.
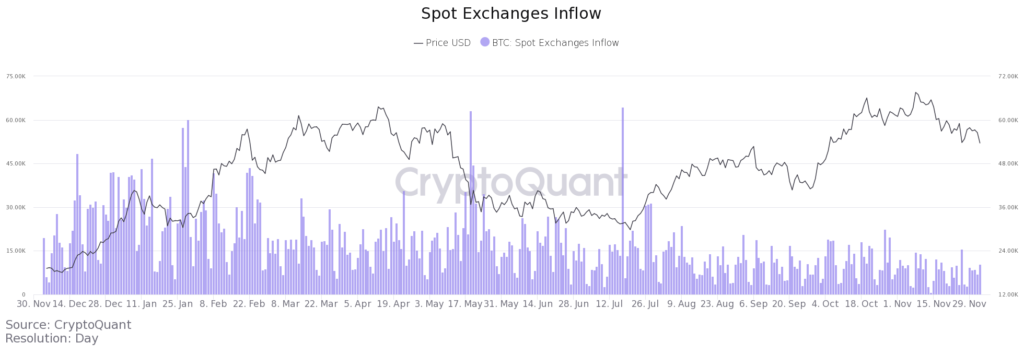
Yesterday AMBCrypto reported 39,000 BTC return exchanges and at that time a hidden bullish narrative was developed. For now, it seems totally invalidated but spot foreign exchange inflows remain low. Frankly, the chain’s fundamentals have remained conflicting as bullish narratives can still be identified, however, the price charts are restructuring and there is nothing bullish about it.
BTC, ETH; Time to welcome another bearish phase?
At the beginning of Q4, 2021, a majority of the market expected Bitcoin to reach $100,000 and Ethereum close to $10,000 before 2021 ends. However, we might have seen the all-time high for now, and the current correction will probably lead to an extensive bearish phase.
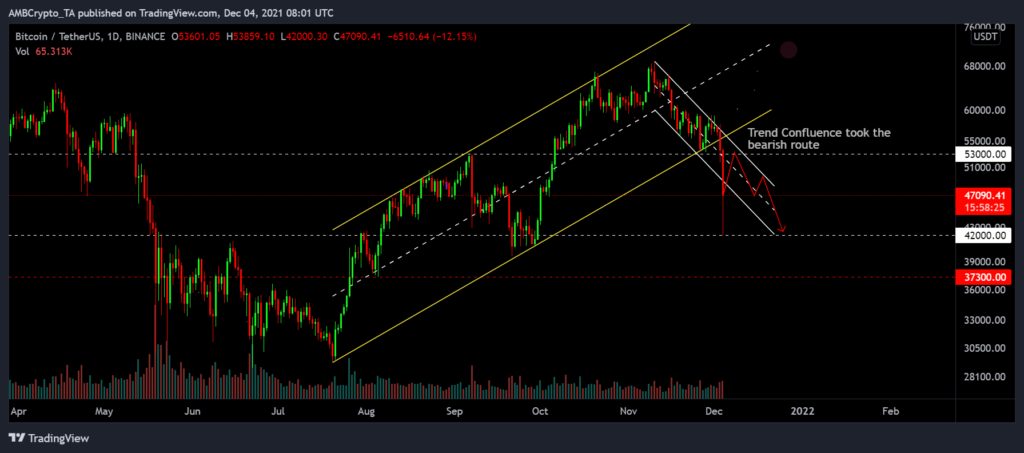
In the previous charts, we have seen Bitcoin bounce off the lower tilt support several times, but over the past few days the market has crossed it. In this sense, its long-term daily chart has also broken an ascending channel pattern.
In addition, BTC was also oscillating within a descending channel recently, and a confluence between both the patterns needed a bullish outcome. That was not the case, and now the market finds itself at the mercy of bears.
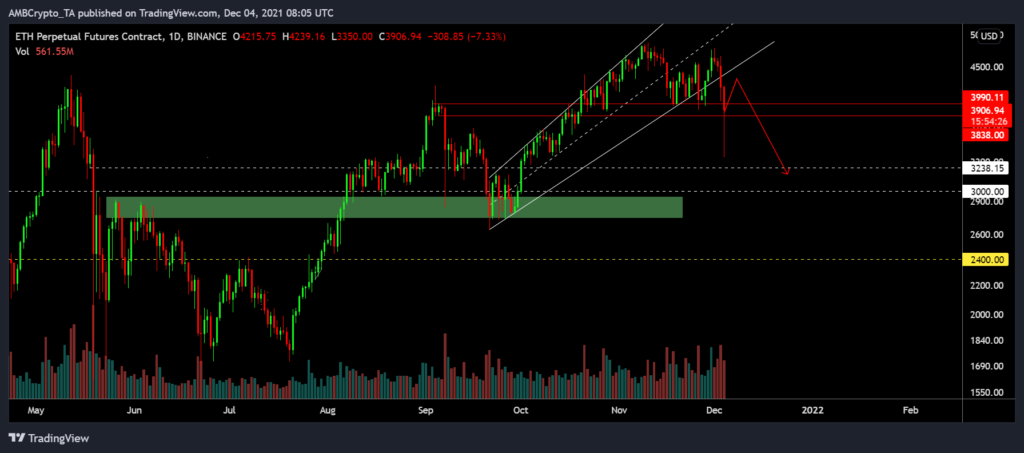
For Ether, it was pretty much the same. Although the asset was $ 100 below its ATH after November 26, BTC’s liquidity outflow may have caused Ether to decline. While Etherum could retest as high as $ 4,300 in the next few years, it will likely be a reactionary withdrawal.
The question remains, should investors buy the dip?
Here are the facts. Bitcoin’s current daily correction wick is the largest since 19 May at 22%. There’s still before a daily close but it is unlikely that BTC’s correction has reached a conclusion out here. The price is probably going to fall further in the charts, and there will be corrections down to $42,000 in the near future. For Ethereum, a similar trend can be expected with a drop-down to $3200 in the next few weeks.