The last 24 hours have been pretty good for the cryptocurrency markets as most of the coins are painted green.
There seems to be a fundamental reason for this, and it hides within the Fed’s decision to leave interest rates untouched. Bitcoin spiked by almost $3K immediately after the news, and the rest of the market followed.
Technical analysis (mid-term)
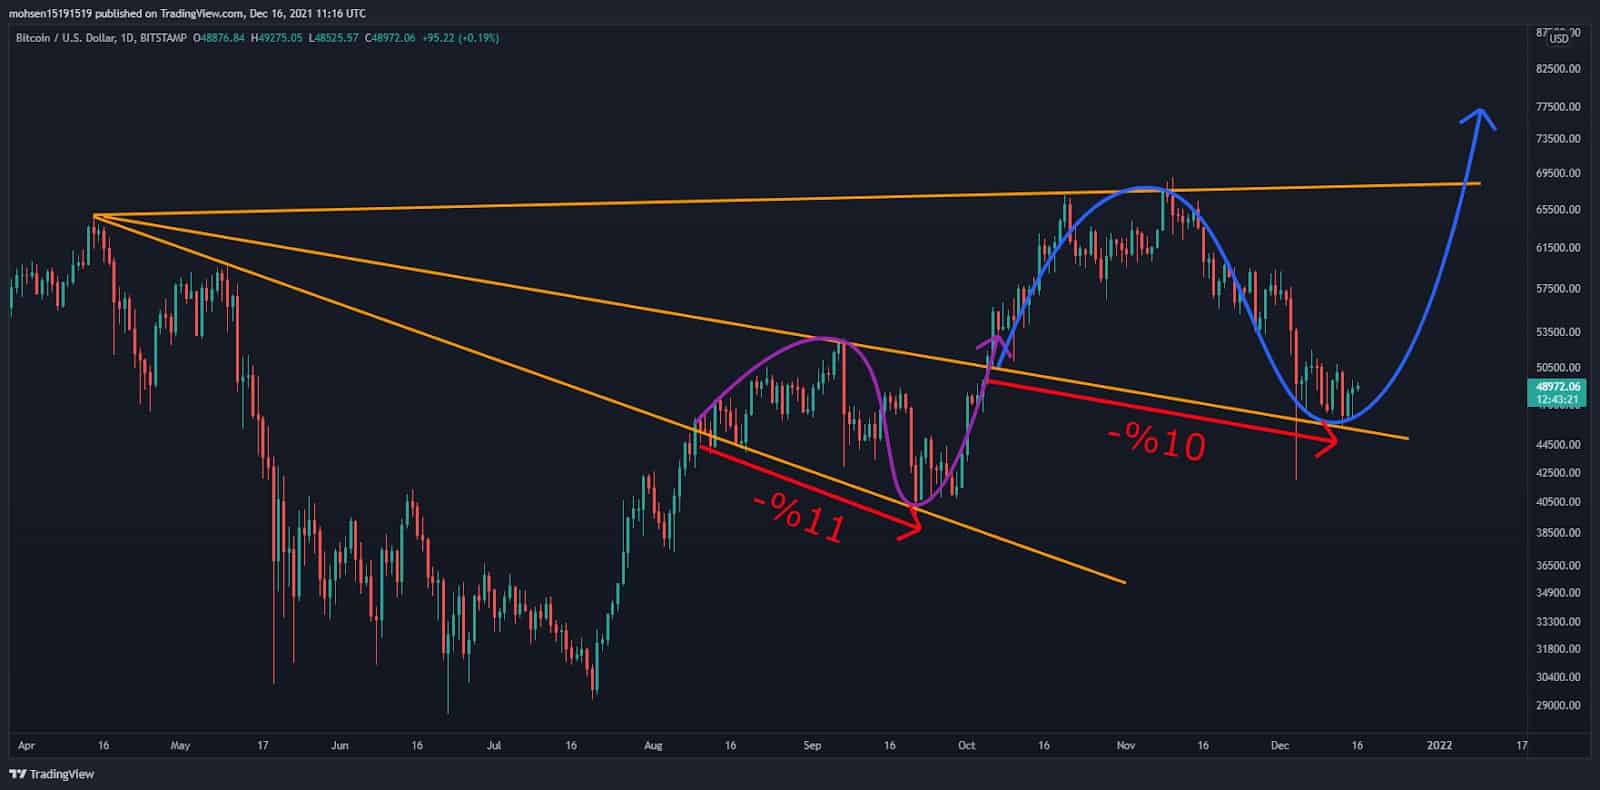
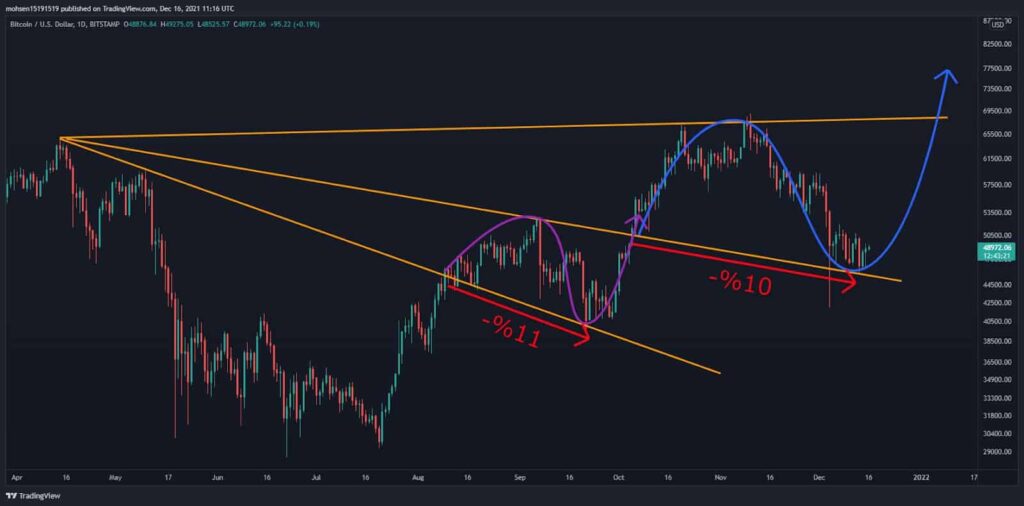
Let’s take a fractal look at the daily chart. In the previous market correction, the retreat from the broken downtrend was about 11% below the break point, and after that, a bullish movement started. This led to the registration of a new ATH. During the recent market correction, the downtrend retreat was about 10% below the break point, and now the price is moving sideways and bottoming. we have to wait and see if, like the previous move, Bitcoin can still set a new ATH or not.
Technical Analysis (short-term)
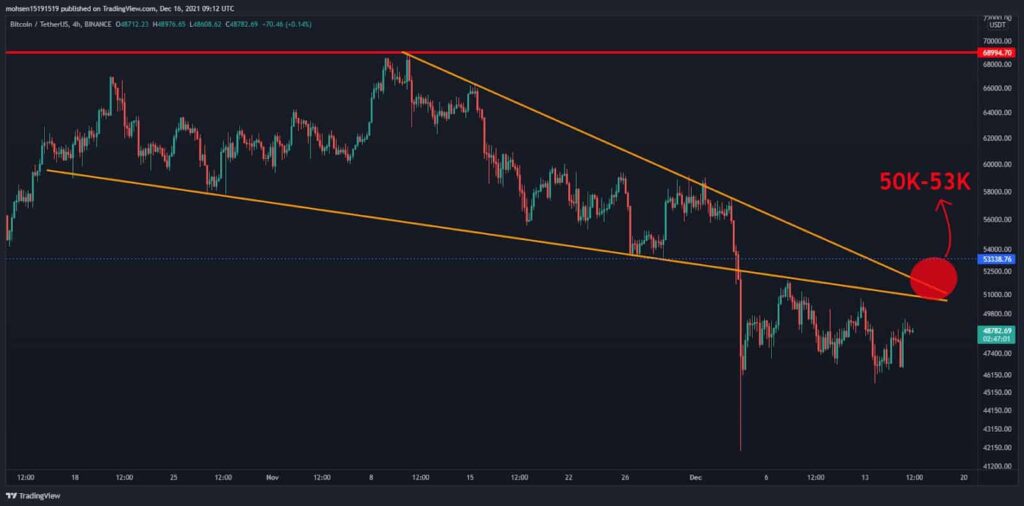
Despite last night’s news from the Federal Reserve and a 5% rise in price, Bitcoin still could not make even a higher high, and it seems that in the low time frame, there are still no signs of a reversal. The $50k-$53k area is still a strong resistance on the way of BTC to go up, and crossing this area could restore hopes of continuing the uptrend.
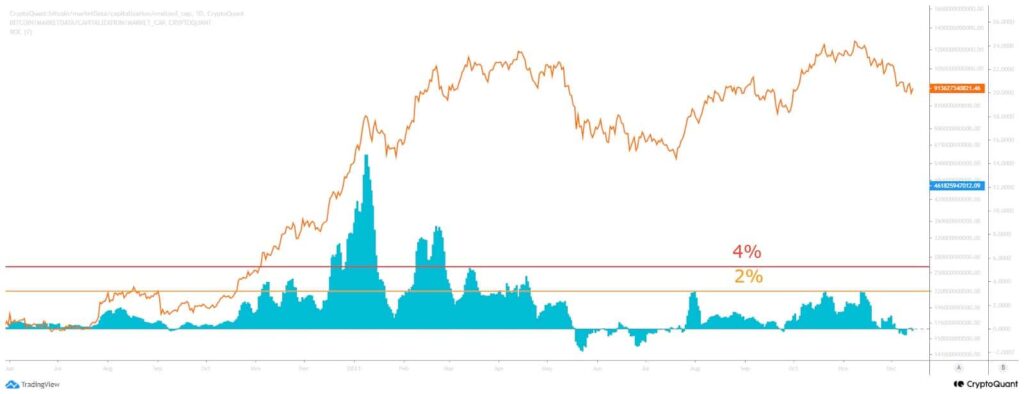
Chain analysis
Looking at Realized Cap’s 7D Oscillator, it is evident that the BTC market has started to record significant losses. Similar to May 2021, we could stay in this telemetry phase before going back to the green days.
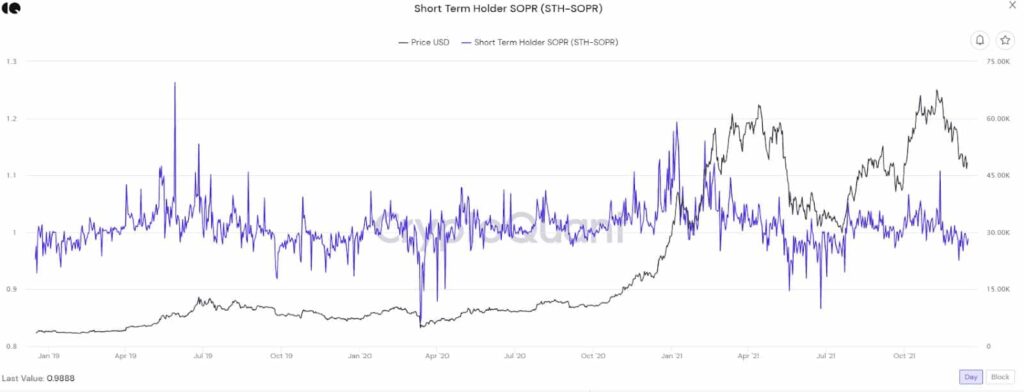
To determine the main class who took the significant portion of the damage, we can look at the STH-SOPR. The overall trend is now fluctuating less than one, which can be translated to “short time holders are selling mostly on loss.”