Bitcoin volatility continues. After falling below $ 46,000 on Monday, BTC was able to recover sharply, marking Tuesday’s high above $ 49.3,000 at the time of writing.
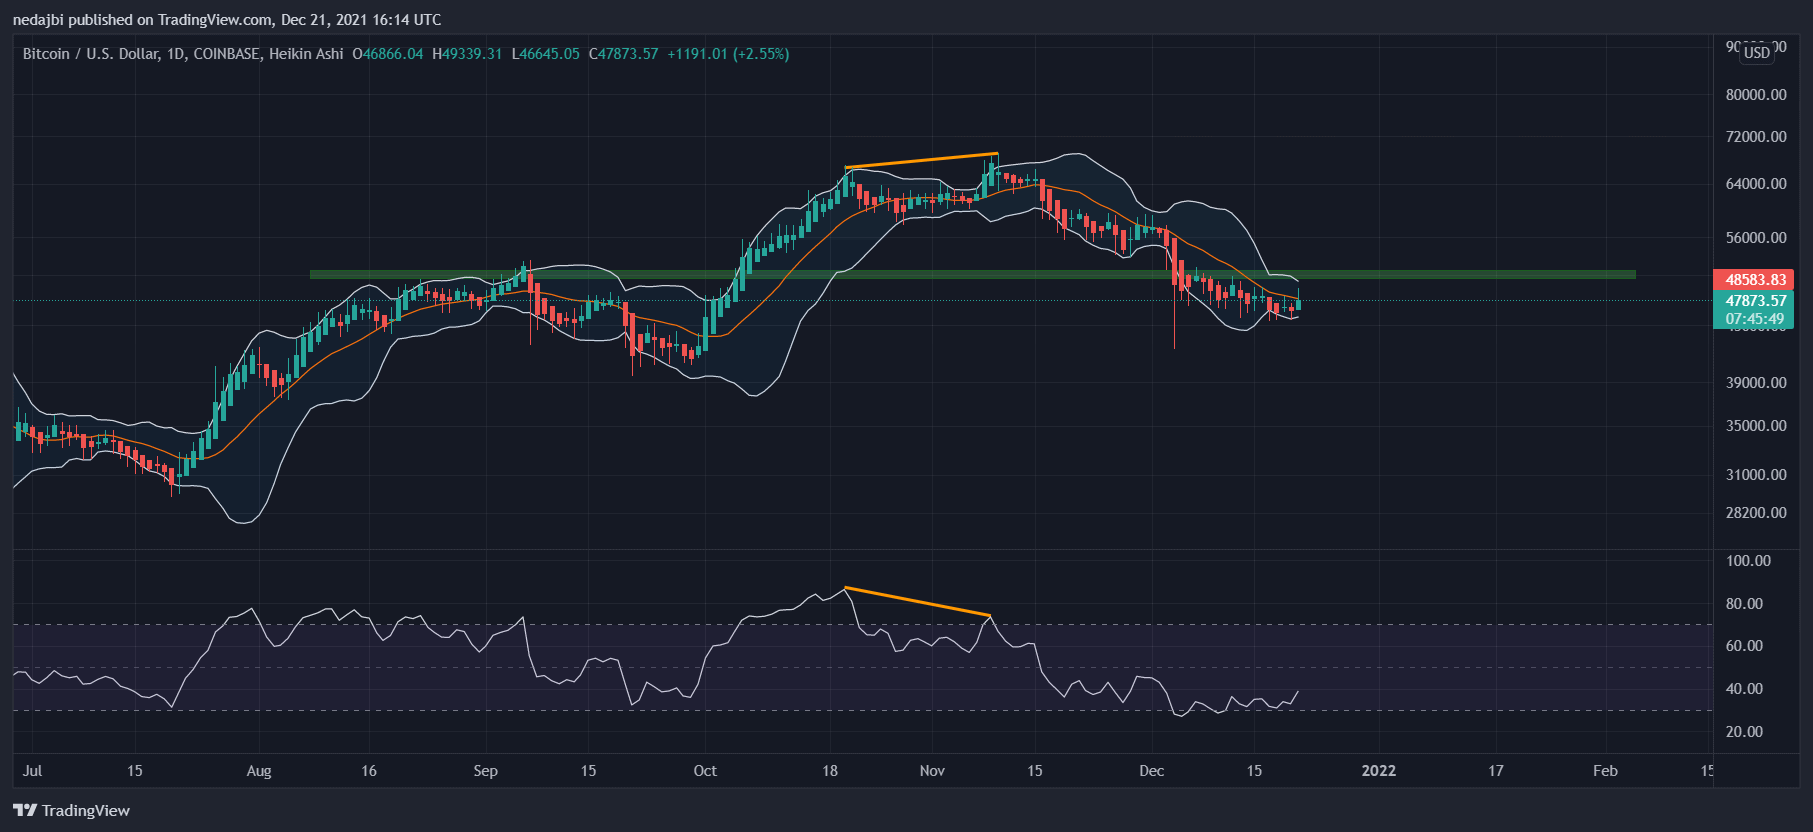
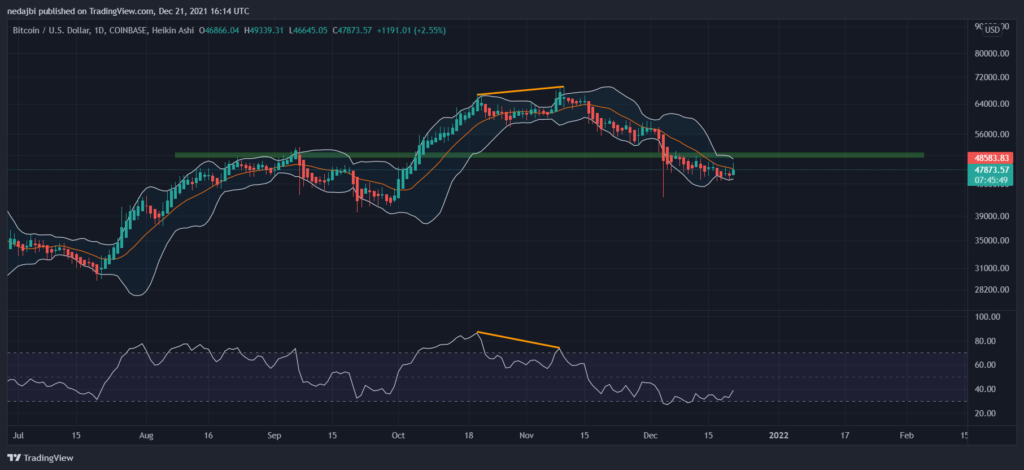
Looking at the following chart, the middle line in the Bollinger Band might act as a support level for the ascending trends, and at the same time, it acts also as a resistance for the descending trends.
After the bearish divergence was confirmed – as seen in the chart below – the price of bitcoin fell from its ATH levels ($ 69,000). The price was unable to break through that midline on Dec. 1 and plunged shortly thereafter to $ 42.1K. Today, Bitcoin attempted to break that line for the second time. A first bullish sign of reversal can be confirmed with the daily close of the candle above this line.
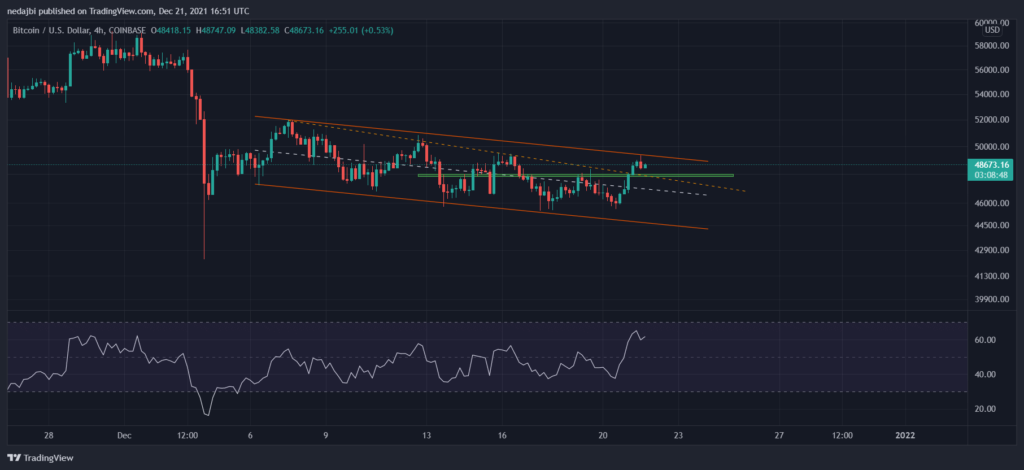
BTC is moving inside a descending channel. In the following 4-hour time frame chart, it reached the upper band of the channel but could not break it out. It seems that bitcoin is pulling back to the marked zone, for now. As per the confirmed bullish divergence mentioned in yesterday’s analysis, if the pullback finds support on top of the marked area, we can expect higher prices in the short term.
Chain analysis
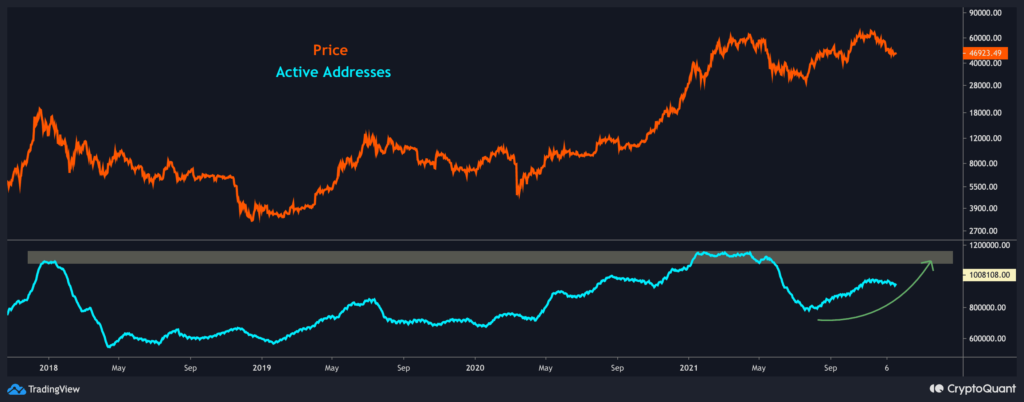
Although Bitcoin registered a new ATH on November 10, 2021, the total number of active addresses is well below its previous highs in the first quarter of 2021. This indicates that network activity is still low. So, we need to see new inflows of capital, made by new investors and traders.
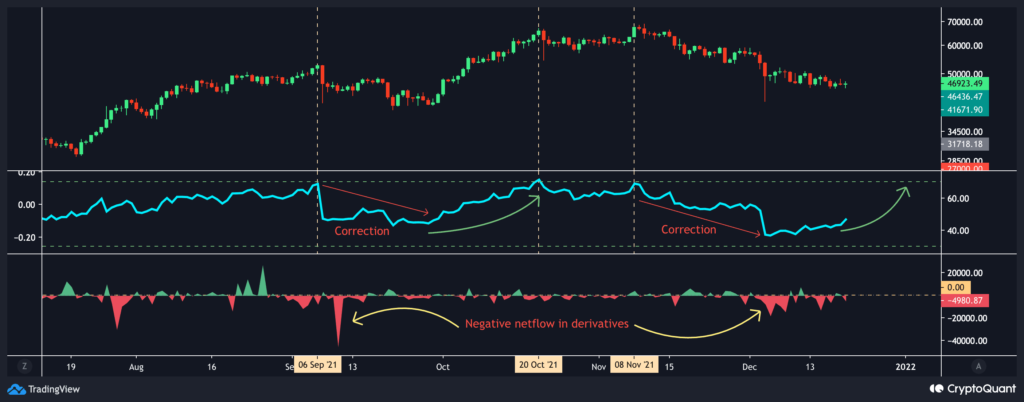
Historically, Open Interest’s RSI reaches the overbought zone when the price tops. Afterward, the price starts a correction phase similar to the open interest.
As can be seen from the chart, we had an overheated futures market with highly leveraged positions. At the same time, BTC hit a new ATH of around $ 69,000.
Still, the price experienced a shakeout after that, and the futures market started to cool down. Hence, many long positions got liquidated during the shakeout.
Right now, we are at similar levels to the last time the BTC price started a $ 40,000 rally in late September. Negative Derivatives Netflow and the RSI of open interest indicate that a future market rally may be underway. Based on this, the correction phase could end soon, so we can expect another bullish rally soon as futures market sentiment turns positive again.