The bitcoin price had recently reclaimed the $50K mark, topping a 16-day high.
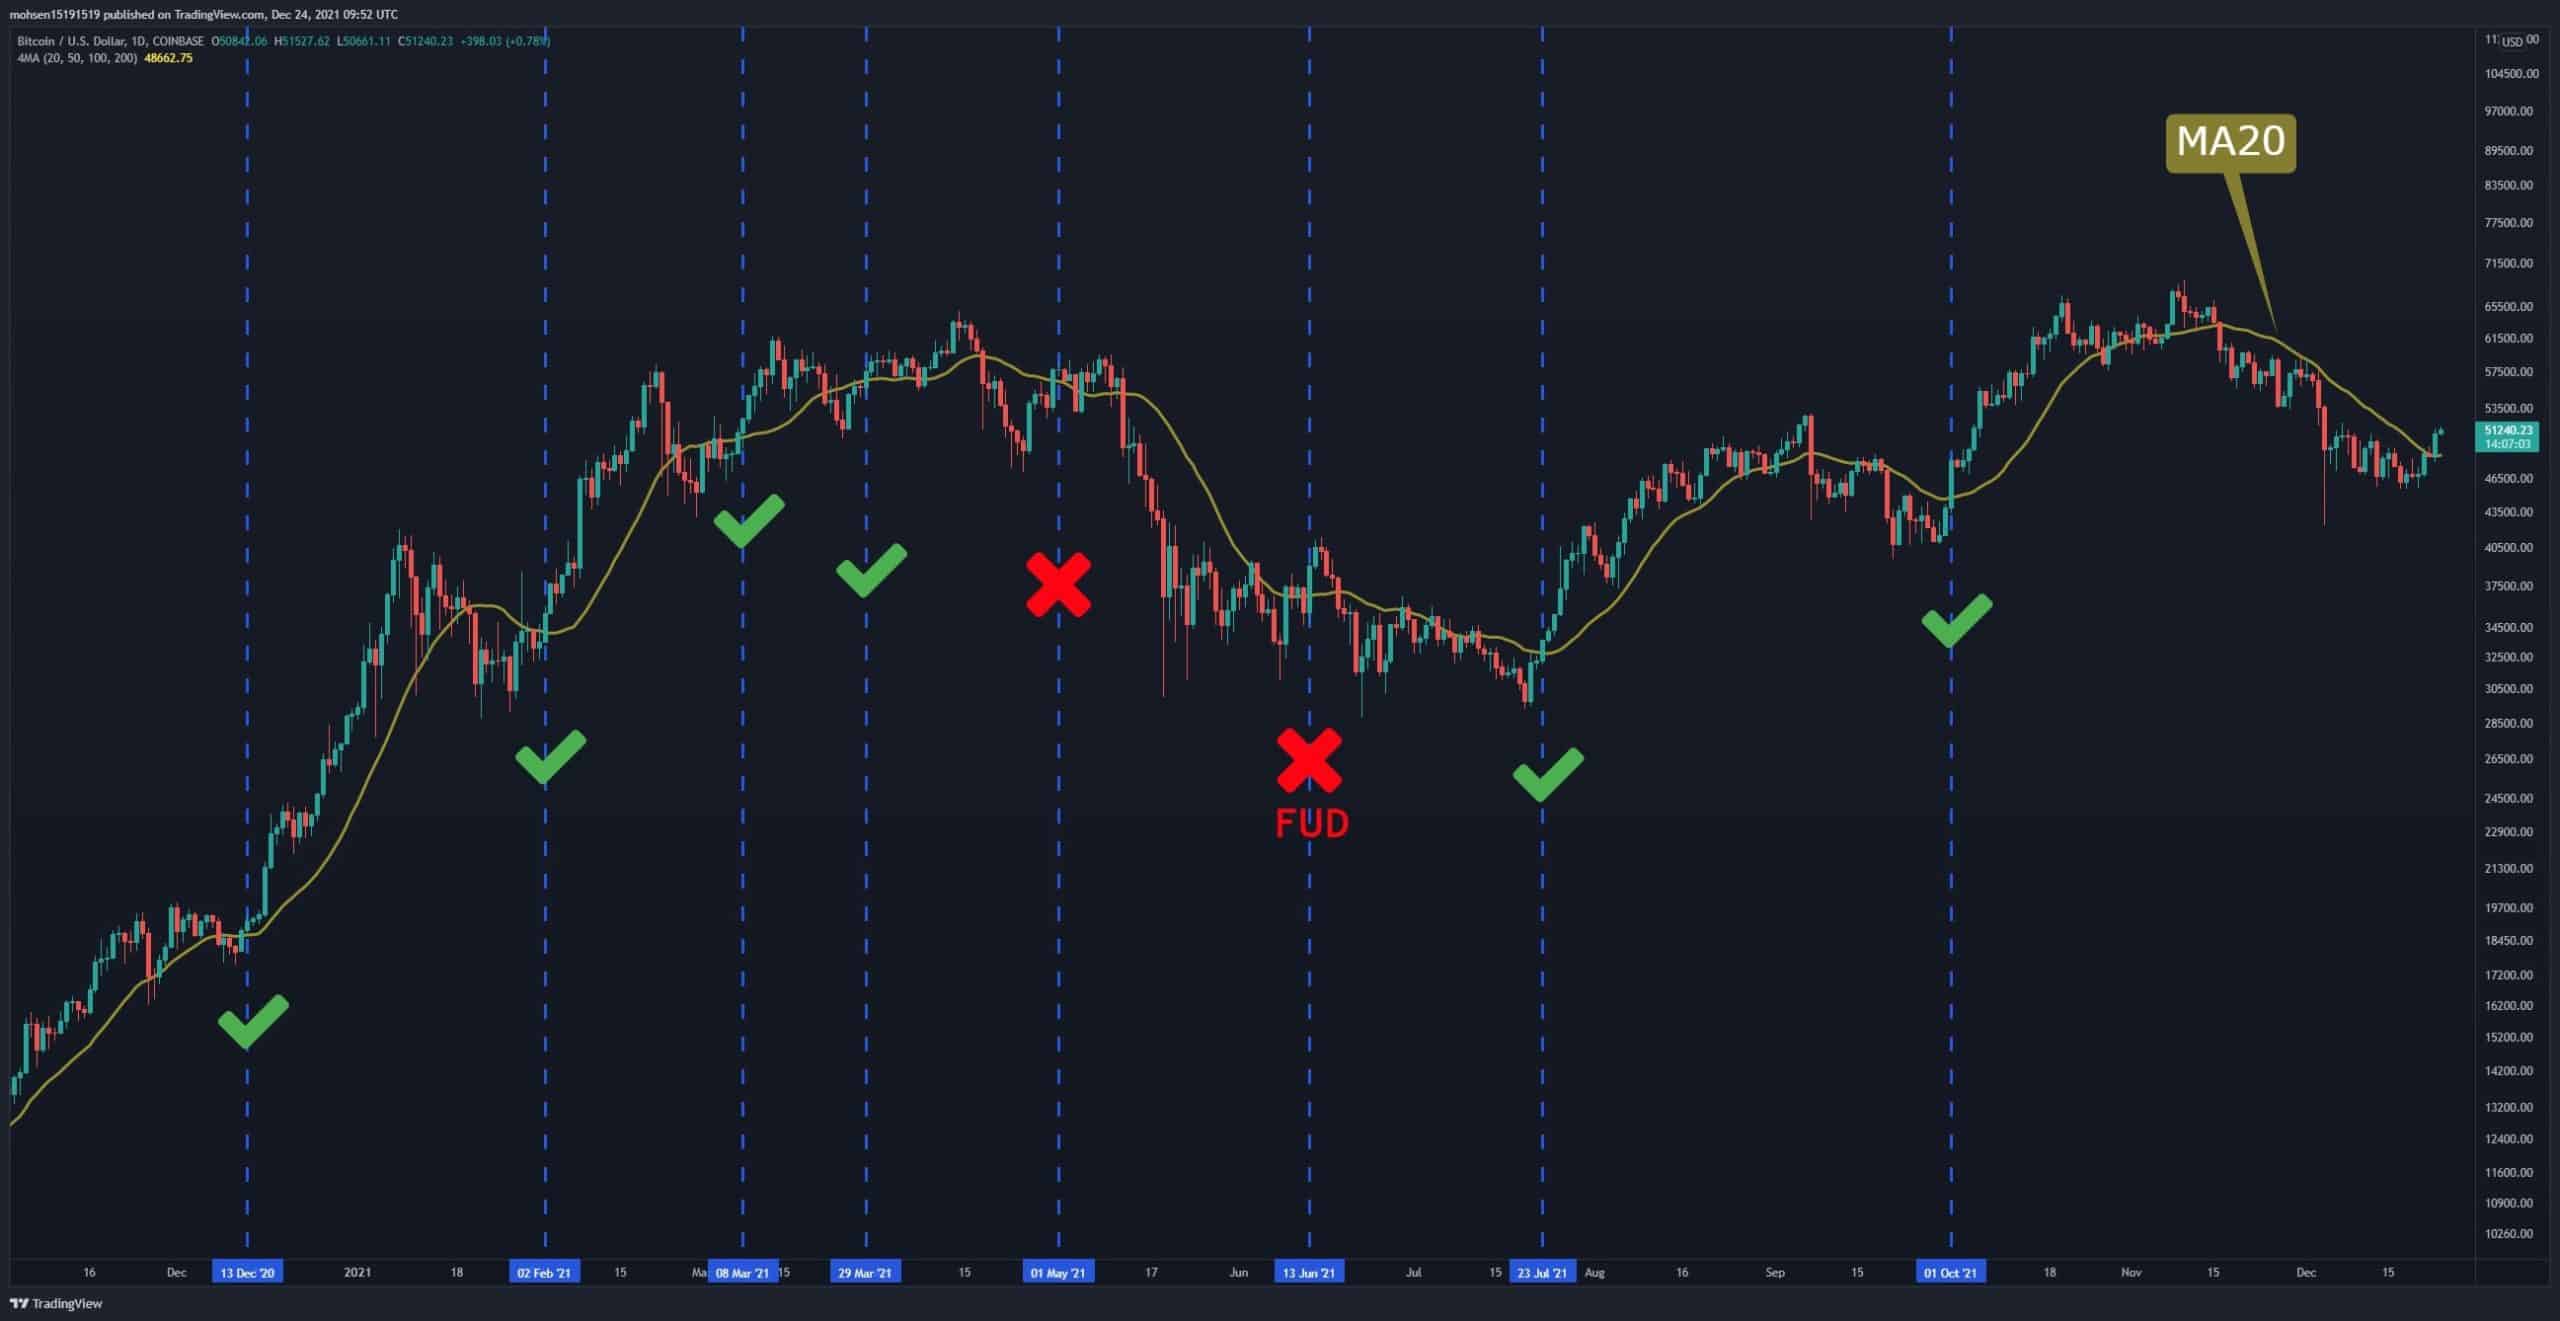
Reviewing the last year’s significant corrections, we can find an interesting pattern in the daily time frame; Breaking above the 20-day MA line and closing a candlestick above has frequently led to an upward trend.
This pattern has been repeated six times but failed twice. The first failure was due to the fact that the market was already overheated. The second failed incident was due to FUDs caused by China banning miners and Elon Musk’s famous tweet of Tesla stopping accepting Bitcoin. The 20-day MA is already broken, and a candlestick has closed above it. So we have to wait and see if this will initiate a new Bitcoin rally.

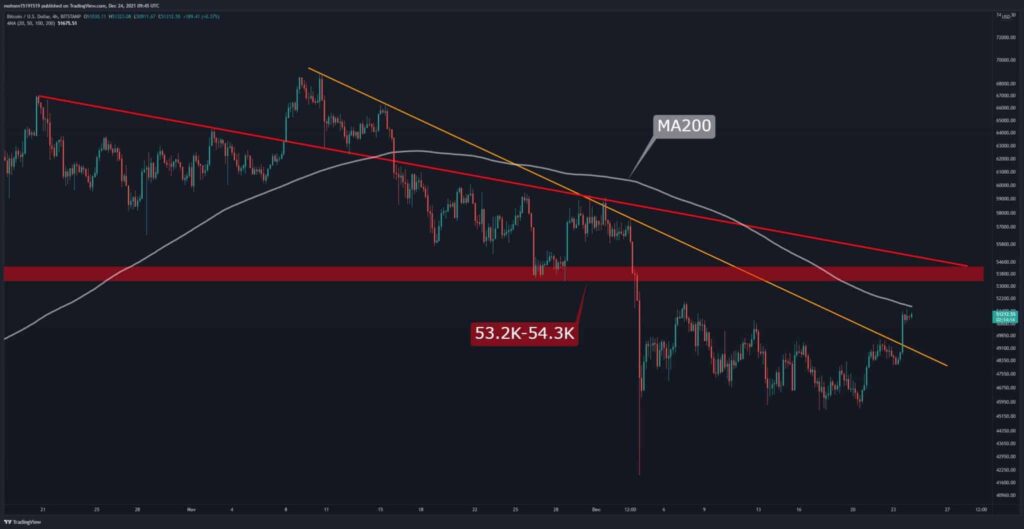
On the shorter timeframes, bitcoin succeeded to break above the dynamic descending line (marked yellow on the following chart) and is currently struggling with the MA-200 line on the 4-hour timeframe, after trading below it for almost 40 days.
Breaking above this resistance could see a continuation run to reach the static and dynamic resistances at $53 – 54K. Many analysts think the price may retrace back from this area.
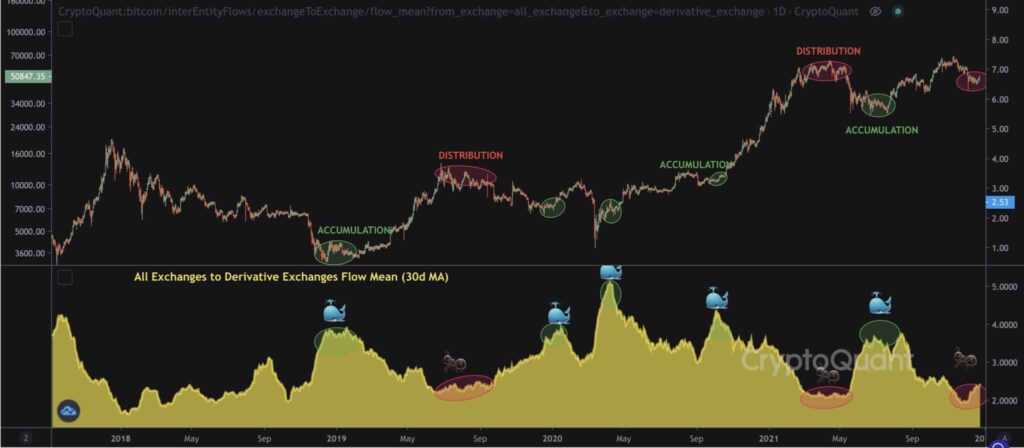
Onchain Analysis
Most of the on-chain metrics confirm the supply shock scenario in the mid-term timeframe. The only concerning point to highlight is the mean size of transactions from other exchanges to the derivative exchanges.
Lower levels in this chart mean that the retail traders are the majority of the perpetual futures market. Therefore, the short-term price action is expected to be volatile.