Bitcoin’s side action continues. Since the start of 2022, the price of bitcoin has been trading in a narrow range of around $ 2,000. This is very unusual for Bitcoin and usually ends with a massive move back and forth.
Option Market Analysis
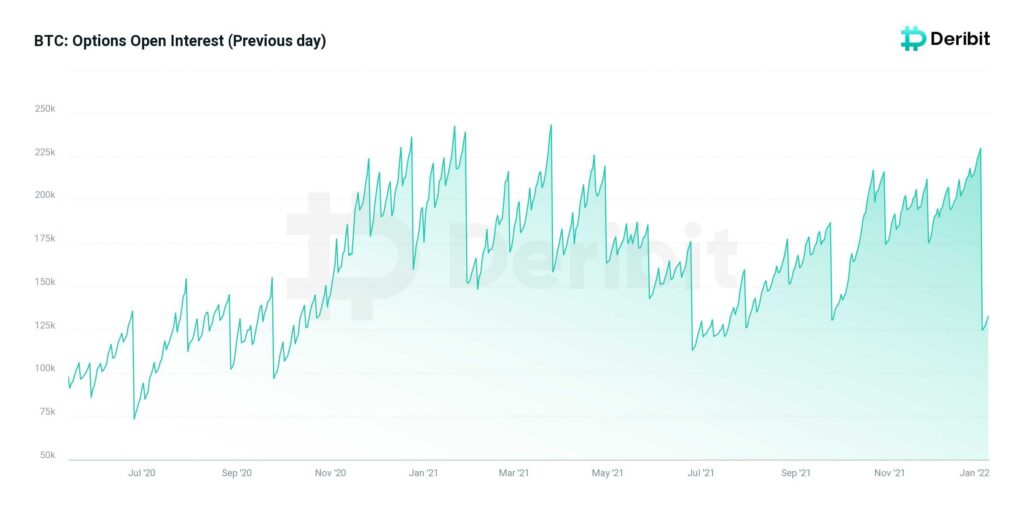
While the bitcoin market is showing weakness, the BTC options market has seen a sharp open interest decline after 2021‘s most significant options expiry.
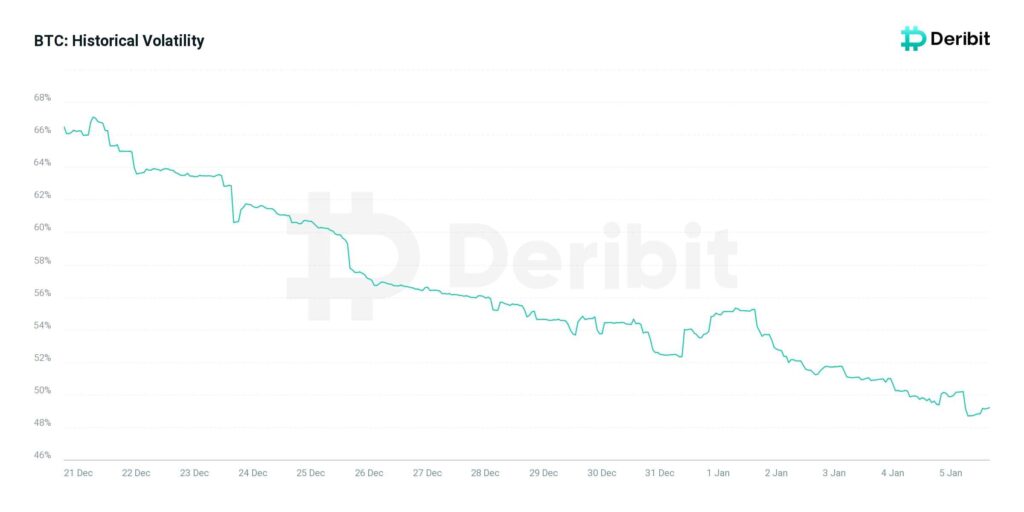
Bitcoin’s historical volatility level has fallen sharply and currently stands at 49.2%. It seems that for now, many large investors prefer to hold their positions and wait for the next price movements over the next few days. It is safe to say that uncertainty is evident among options traders.
Technical Analysis: The Short Term
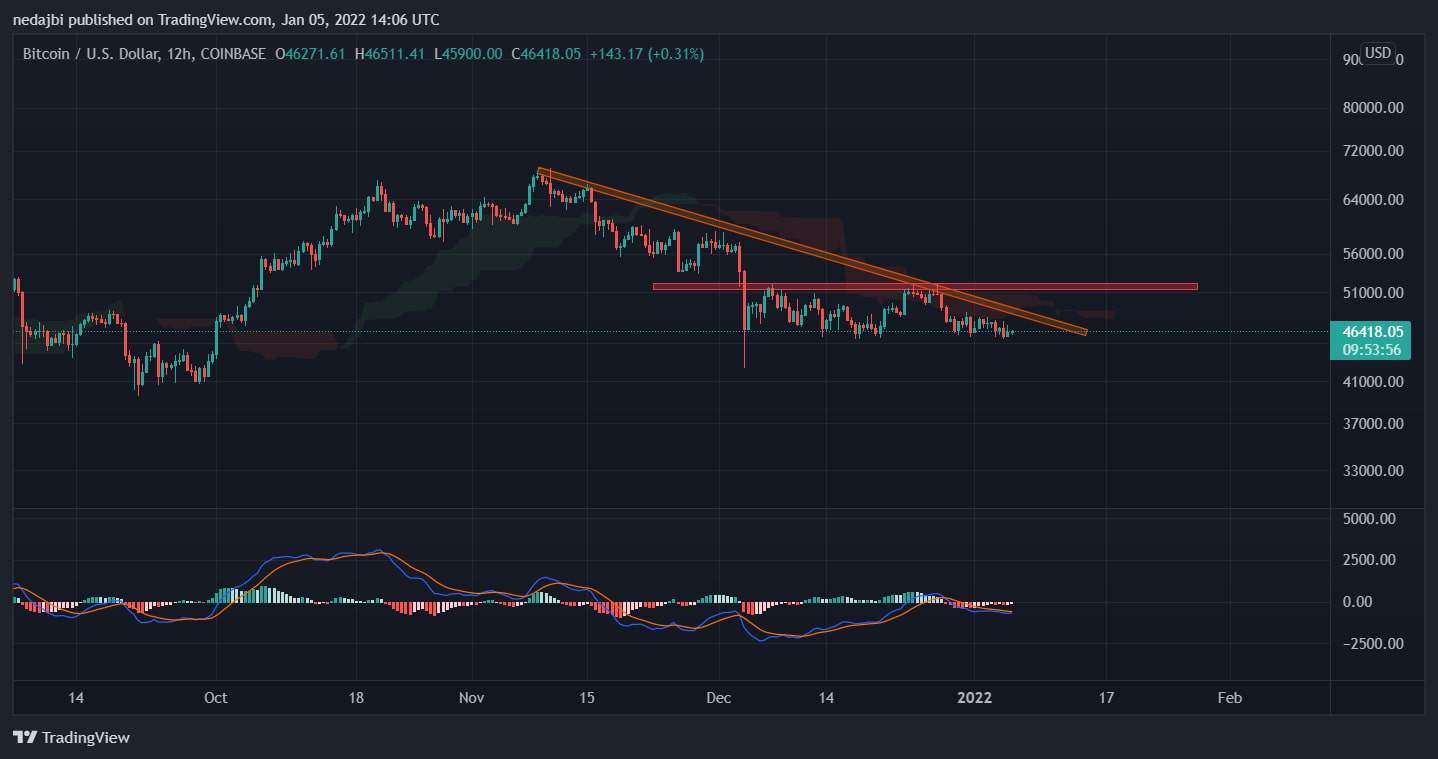
Looking at the 12-hour time frame chart of BTC, there is significant resistance, preventing any possible recovery unless broken. Moreover, the diminished demand in the spot market, at the moment, lowers the chance of a bullish breakout above the mentioned resistance.
The price of Bitcoin is now trading below a descending trendline and the Ichimoku cloud as shown below.
The $48.5-49K resistance range is a substantial obstacle for any bullish price action. To move higher in this time frame, bitcoin needs to break out the $49K resistance and close a candle above it.
Another major resistance area is shown in the chart, which is the $ 51.5-52,000 area. The rejection of these two areas could lead to a further decline towards the $ 40-42,000 area, which served as sophisticated support on December 4th (December low).

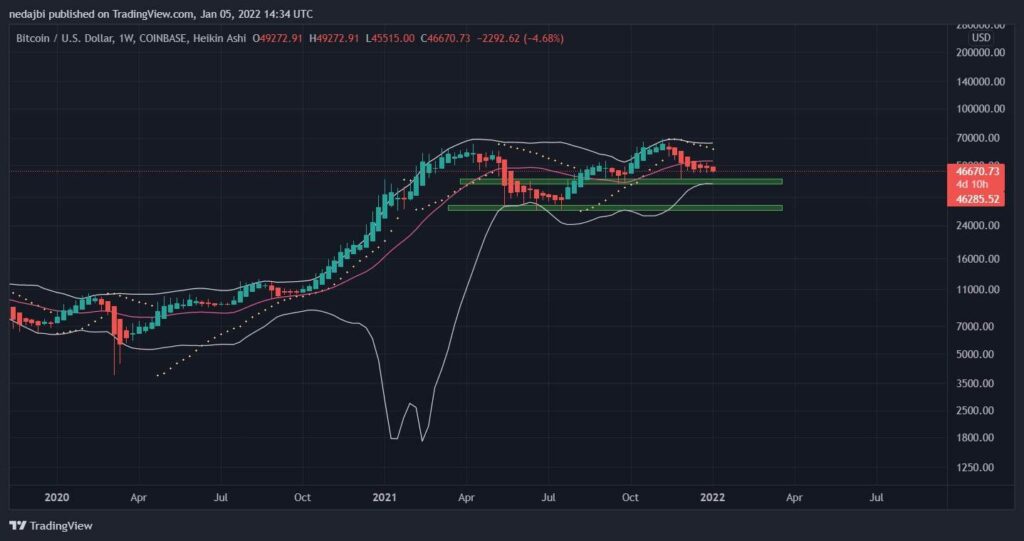
The Weekly
On the weekly time frame, bitcoin had lost the midline of the Bollinger band as dynamic support and pulled back since then.
However, he was unable to retrieve that line and fell to $ 45.7,000. In case bitcoin cannot break through the critical resistance of $ 53,000 this week due to the Parabolic SAR, indicating a downtrend over this period, bitcoin could hit the lower Bollinger Band in the coming weeks. The possible supports are indicated in the graph.
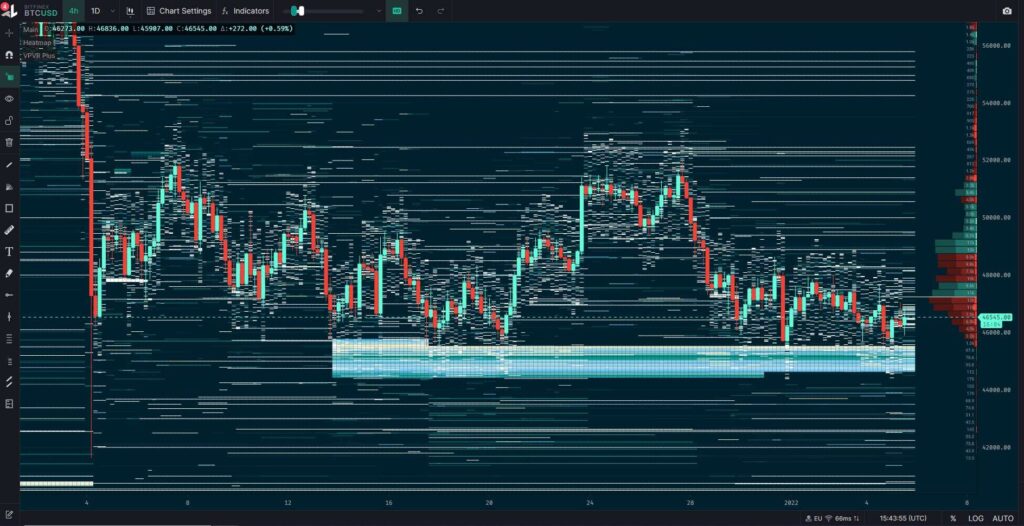
Order Book Analysis
The following order book analysis, which looks at the open BUY/SELL limit orders on different exchanges, has recently attracted much attention.
An interesting example, shown below, features the BUY wall on Bitfinex in a range of $ 44-45,000. This range has been strong resistance since mid-December.
These BUY/SELL walls must be monitored closely because the orders can be canceled at any moment. Moreover, we should be cautious about the order book analysis before utilizing it in our trading plan.