
BeInCrypto takes a look at on-chain indicators for Bitcoin (BTC), more specifically the Market value to realized value (MVRV).
MVRV for BTC
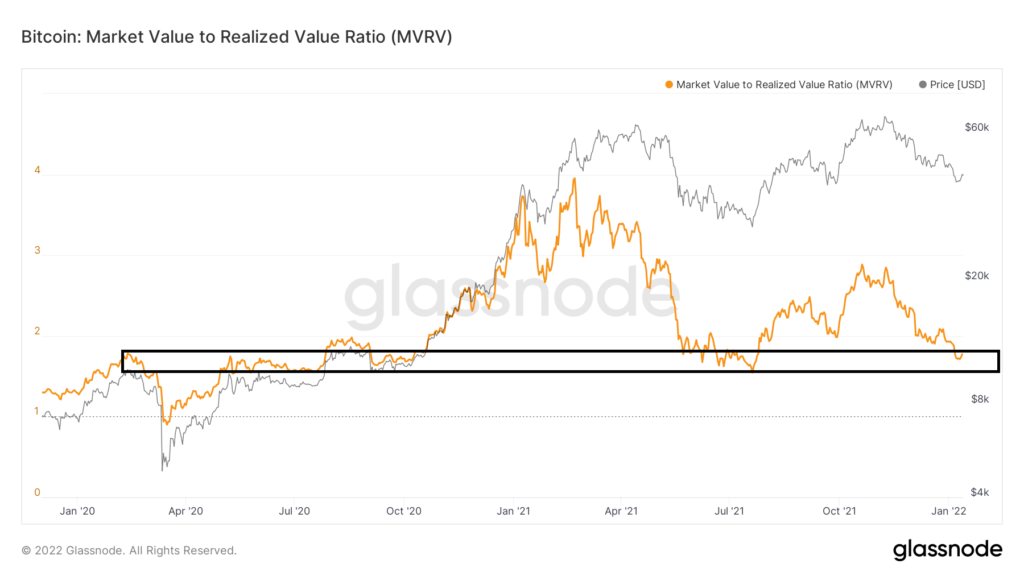
MVRV measures the ratio between market and realized capitalization levels. Values greater than one indicate that the market capitalization is greater than realized. Very high ratios show an overvalued market.
The indicator currently gives a reading of 1.71. Historically, this entire 1.70-1.80 area has been crucial for determining the direction of the trend. It initially acted as resistance in early 2020, prior to the March 2020 bottom. After a period of consolidation inside it, an upward movement began on Oct 2020, leading to the current all-time high price.
Subsequently, the zone rebounded from the July 2021 low.
MVRV is back inside this area once more. It is crucial that it bounces in order for the bullish trend to remain intact.
Previous readings
Looking at all of the indicator’s values since 2011, we can see that it has generated bearish divergence (black lines) only twice in its history.
The first transpired over a three-month period between June – Sept 2017. While the BTC price moved from a high of $2,000 to $4,000, the indicator dropped from 3.6 to 3. This meant that while the BTC price increased, the difference between its market and realized capitalization levels decreased.
Since an increase in the price of BTC always leads to an increase in market capitalization, this means that the realized capitalization has increased at a higher rate than the market capitalization. It can be seen as a bullish sign, since it would suggest that the rise in prices is accompanied by an increase in transactions.
The second divergence transpired over a seven-month period, more specifically from Feb to Oct 2020. The BTC price moved from a high of $64,854 to the current all-time high price of $69,000. However, the indicator reading fell from 3.95 to 2.84. Therefore, the current bearish divergence was even more pronounced than the 2017 one.
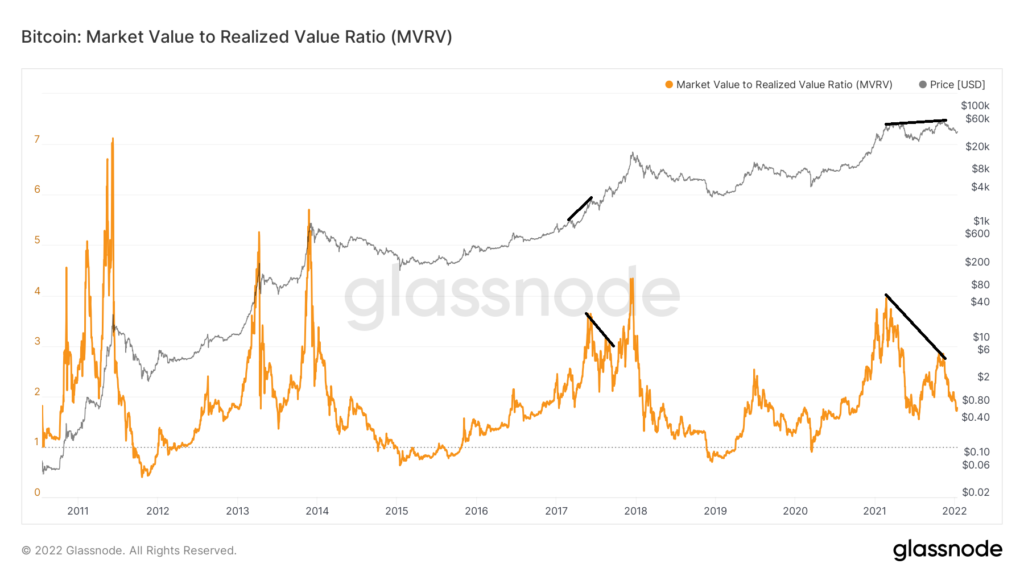
After the 2017 divergence, BTC followed a parabolic run and went from $4,000 to $20,000 in just under six months. It remains to be seen if the current divergence will yield a similar result.