Bitcoin (BTC) was rejected by the $44,200 resistance area on Jan 13 and is currently trying to find support.
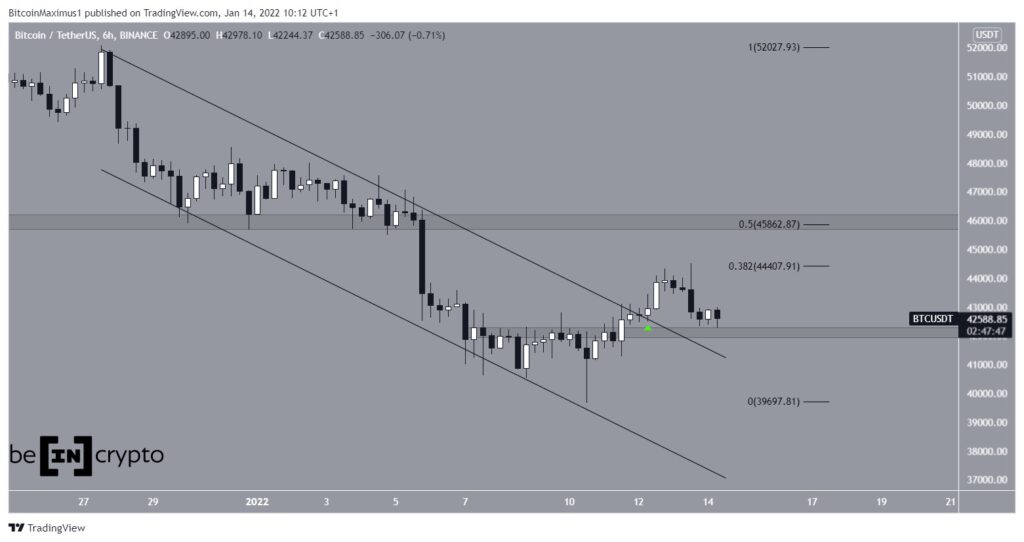
On January 22, BTC broke out of a descending parallel channel that had previously been in place since December 27. It was a sign that the correction had ended.
It continued to increase until it reached a high of $44,500 on Jan 13. The high was made right at the 0.382 Fib retracement resistance level when measuring the previous downward movement.
While there was stronger resistance at $45,800, BTC failed to reach it.
After the rejection, BTC dropped and has now returned to the $42,100 area, which previously acted as resistance. The area is now expected to act as support.
Future BTC movement
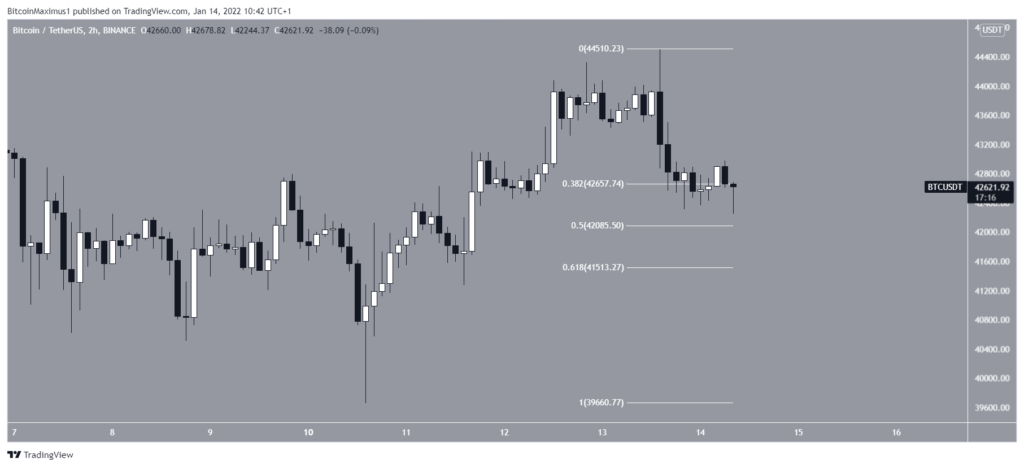
The two-hour chart shows BTC trading between the 0.382-0.5 Fib retracement support levels at $42,100-$42,650. This is a strong support zone that could trigger a rebound.
There is support all the way down to $41,500, the 0.618 Fib retracement support level, which is also a horizontal support area.
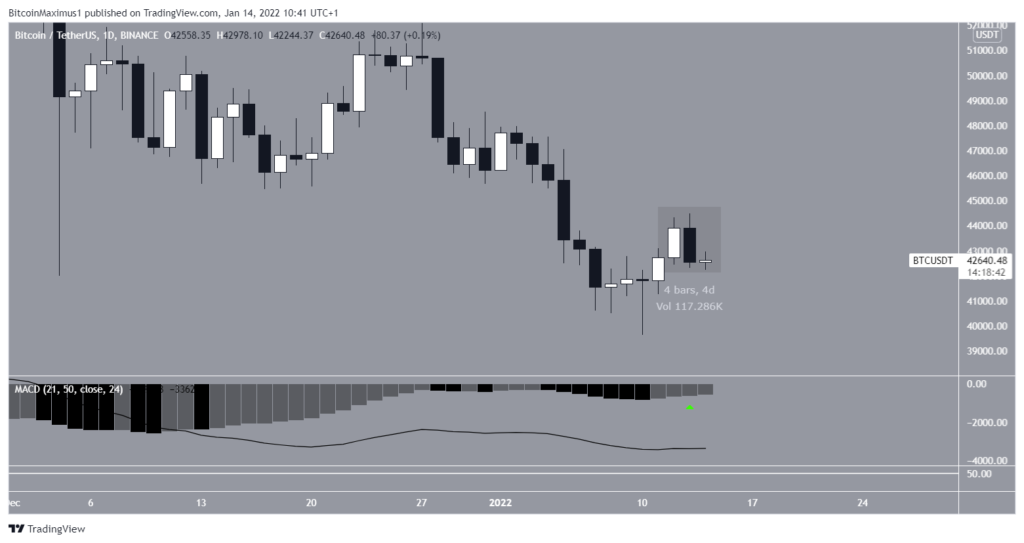
However, the daily chart provides mixed signals. While the MACD generated successive higher momentum bars, a sign of a potential reversal signal, BTC created an engulfing bearish candlestick.
Therefore, while technical indicators are bullish, the price action is bearish, failing to provide a consensus for the direction of the trend.
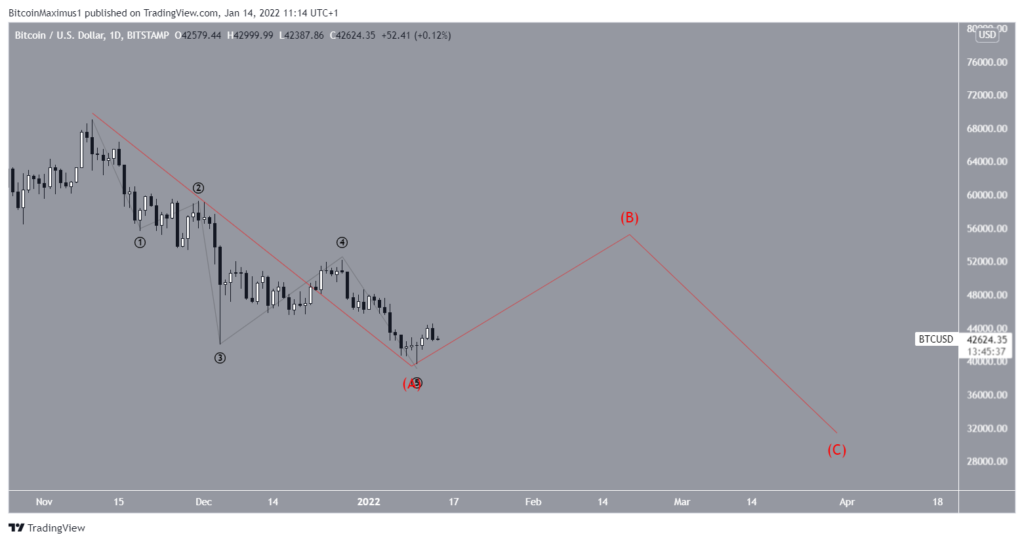
Number of waves
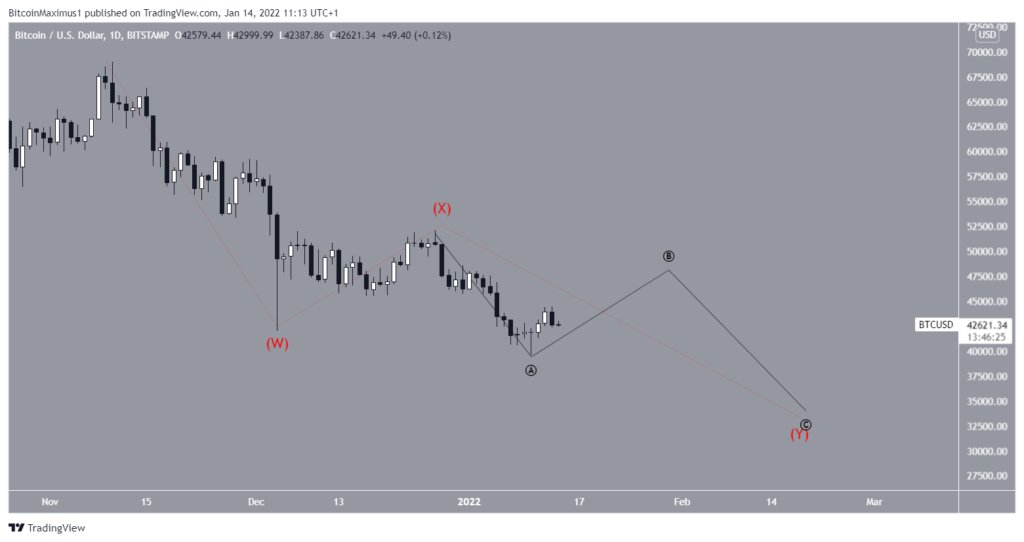
There are two main possibilities for the long-term wave count, both of which indicate that BTC will bounce back in the short term.
The first one suggests that BTC Has been correcting inside a W-X-Y (red) corrective pattern since reaching an all-time high price of $69,000 on Nov 10. The sub-wave count is given in black.
In this possibility, the price will rebound in the near term towards $45,000-$48,000, completing the B subwave before another drop completes the entire correction.
The alternate count also indicates that BTC has been correction since the all-time high price on Nov 10. However, the entire correction has taken an A-B-C structure (red), in which wave A has just been completed.
Therefore, the bounce would be larger, potentially reaching highs near $55,000 before another drop.