Similar to the May-July 2021 consolidation, the market is forming a strong supply/ask level in the $40,000-$42,000 range. Apart from the short-term price trend, the mentioned area will be an important support (or resistance) for the long-term price actions.
Technical Analysis
Many analysts believe the $40K-$42K zone resembles the $30K-$32K range in May-July. Since December 5th, the $40K-$42K zone acted as good support.
But, given the low demand in the spot market, bitcoin may see lower prices if this strong support fails (bitcoin closes a daily candle below). Fibonacci levels are displayed in a daily time frame. The 0.382 Fibonacci level and the overlapping red area is a strong resistance at $50,000-$51.5,000.
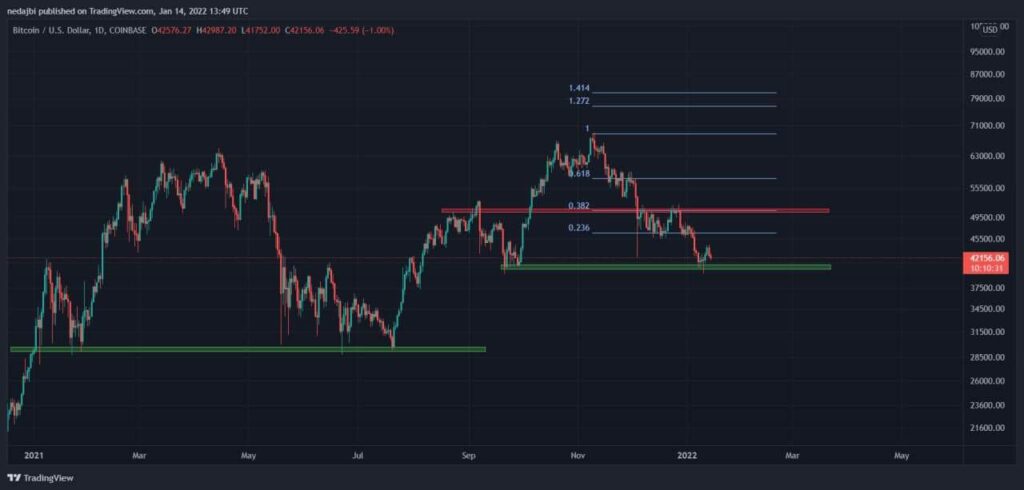
It seems that there will be some selling pressure for this level if bitcoin touches this resistance.
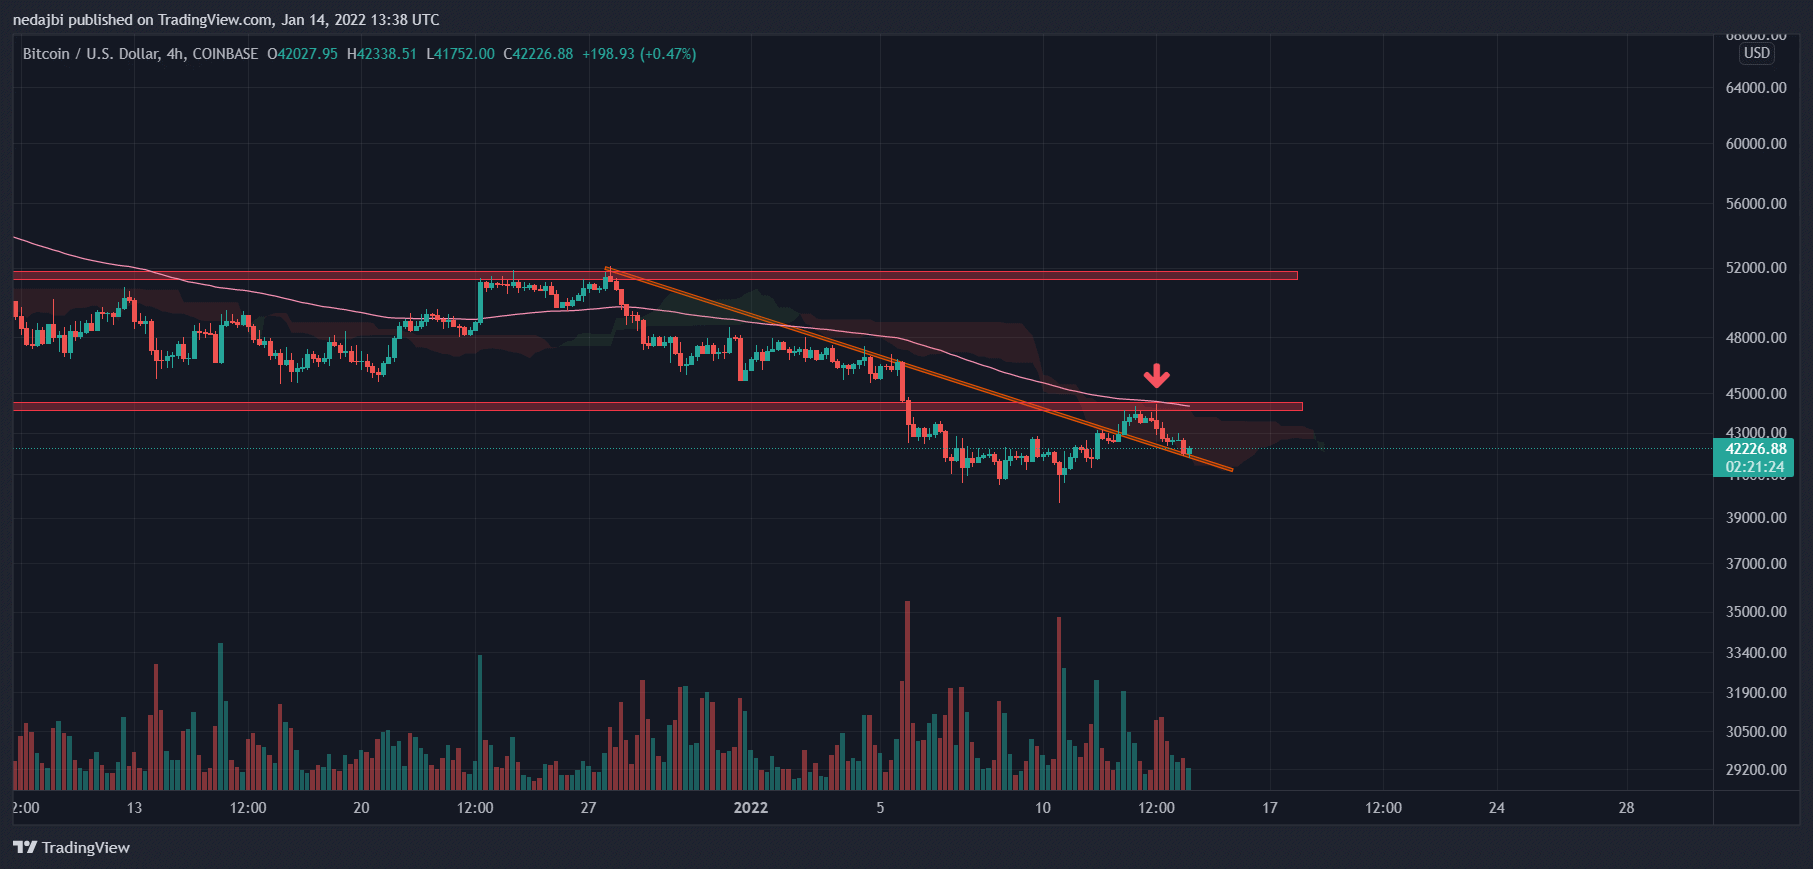
Short term analysis
Despite positive price action over the past week, bitcoin was unable to rise above $44.5,000. As the chart shows, there are several resistance levels up to $50,000. BTC was rejected by several of them, which crossed over and made $44.5,000 to $45,000 a powerful barrier.
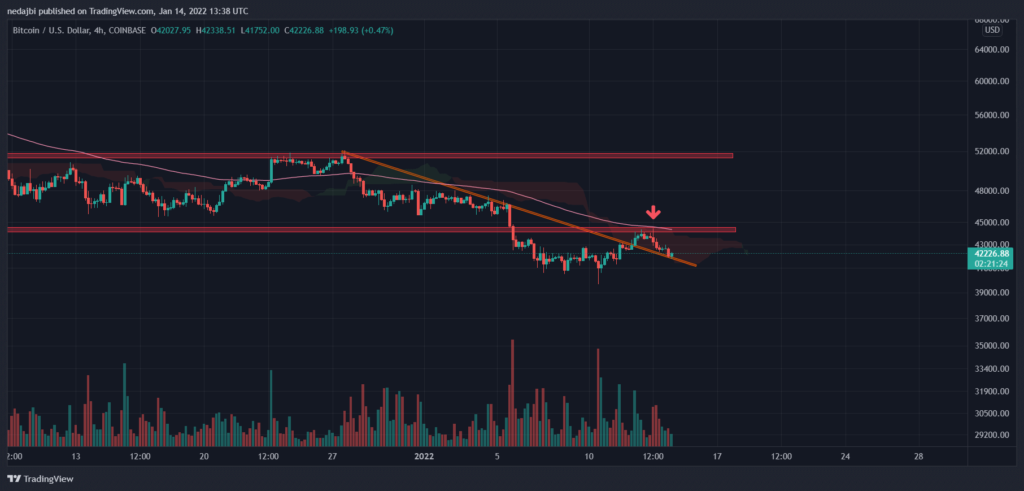
In a 4-hour time frame, bitcoin broke out the bearish trend line (orange line). It seems that the pullback has been completed, and the cryptocurrency can make another attempt to break the $44.5K-45K resistance in the coming day.
Order book analysis
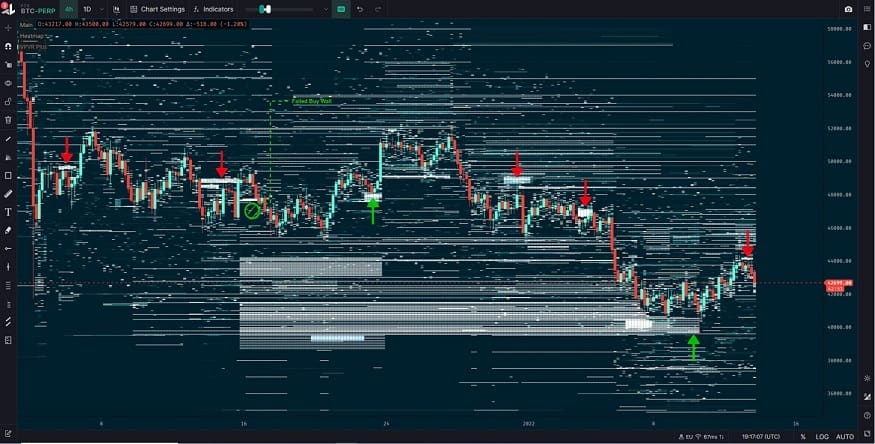
Considering the limit order heatmap, it is clear that FTX has been influential in recent price actions since the market crashed to 40K (Dec 2021). There are many examples where the price has reacted to the buy/sell walls of this exchange. Therefore, it might be a good idea to watch this order book for price actions in the near future.