BeInCrypto takes a look at on-chain indicators for Bitcoin (BTC), more specifically the Market Value To Realized Value (MVRV) and Net Unrealized Profit Loss (NUPL)
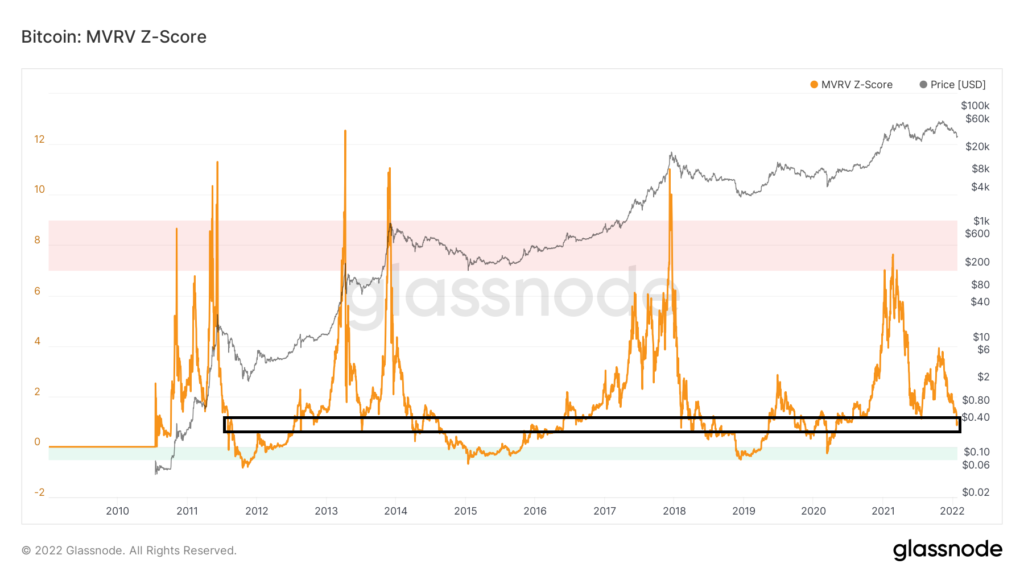
Z-score MVRV
MVRV is defined as the ratio between market capitalization and realized levels. Values greater than one indicate that the market capitalization is greater than the realized capitalization. The MVRV Z score uses a standard deviation to normalize the values.
On Jan 24, the indicator reached a value of 0.85. The low is the first time that the indicator has fallen inside the 0.80 -1.20 range since Sept 2020, when the current bullish cycle was just beginning. Historically, values above this area have been associated with bullish trends, while those below have transpired during bear markets.
Therefore, for the cycle to remain intact, MVRV must bounce and move outside of this zone. A breakdown below 0.8 would confirm that the long-term trend has turned bearish.
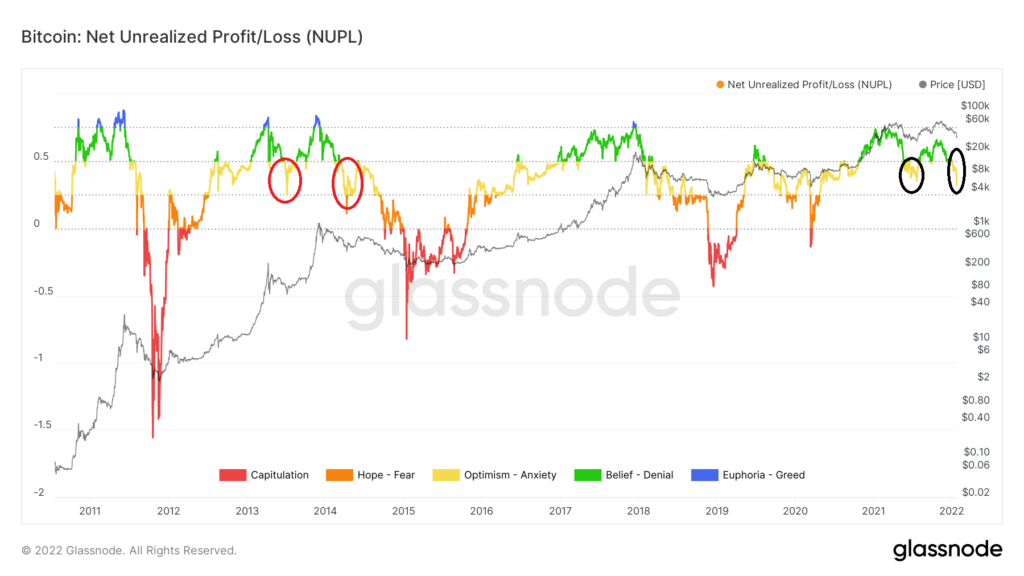
NUPL
NUPL is an indicator that measures the total amount of profit or loss for investors. A reading below 0 means that the market is in aggregate loss, while one above 0 indicates that the market is in aggregate profit.
During the previous market cycle, values above 0.75 (blue) were associated with highs. Conversely, those below 0.25 (red) with dips.
In the beginning of Jan, NUPL fell below the 0.5 region. This was a bearish development, since it was the second time it fell below this level, after that of July 2021 (black circle).
In previous market cycles, the NUPL has only fallen below the 0.5 level once after previously breaking above it while trending up. Therefore, the second drop below 0.5 market the end of the uptrend (red circle).
However, it is worth noting that the current cycle is the first one in which NUPL did not increase at all above 0.75. Therefore, if the current bullish cycle has ended, it would mark the only time in which NUPL has not crossed above 0.75. If not, it would mark the first time that the indicator fell below 0.5 twice before reclaiming the line.
Therefore, the ensuing movement is crucial in determining the future trend. Another recovery of the 0.5 line would go a long way in suggesting that the trend is bullish, while a drop below 0.25 would almost confirm that the trend has turned bearish.