In a recent interview, Vitalik Buterin spoke about the various elements of the Ethereum roadmap and talked about how the hard fork EIP-1599 upgrade is already accelerating transaction speeds. However, the Ethereum network continues to lose the DeFi sector’s TVL to other protocols as gas fees on Ethereum are considered costly.
On the price charts, ETH has been on the road to recovery over the past two weeks. Its recent bullish momentum should break the $3411 level to signal the possibility of a longer-term shift in market structure.
Ethereum – 12-hour chart
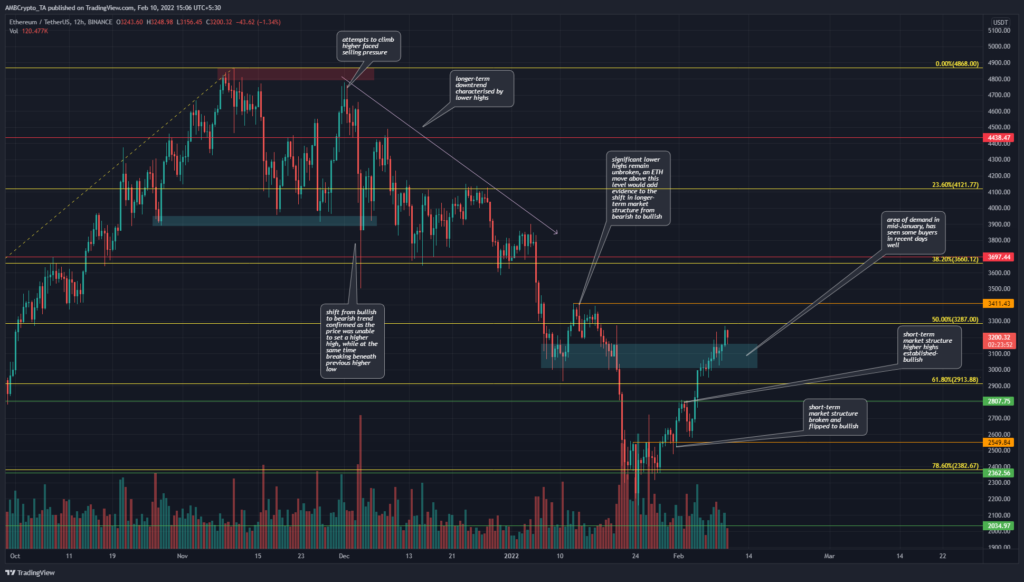
Since the market structure changed from bullish to bearish in mid-November, ETH has risen from $4,000 to $2,159 at the end of January. Since that low, the price has recovered somewhat. Indeed, he saw a rising impulse after the rally above $2382.
Based on ETH’s move from $1706 to $4868 from July to November in 2021, a set of Fibonacci retracement levels (yellow) were plotted. They showed the 78.6% retracement level at $2382, which was close to a long-term support level at $2362. This was also the area where ETH appeared to reverse the strong bearish momentum.
The last two weeks saw the market structure turn bullish once $2459 was broken and retested as support. However, the market structure can be both bullish and bearish simultaneously depending on the time period of interest.
Therefore, risk-loving long-term investors would like to place bids in the $2900-$3150 area (cyan box), in the hope of catching ETH’s next move north. More risk-averse investors can wait for the $3411 level to be broken and retested before buying the asset.
Rationale
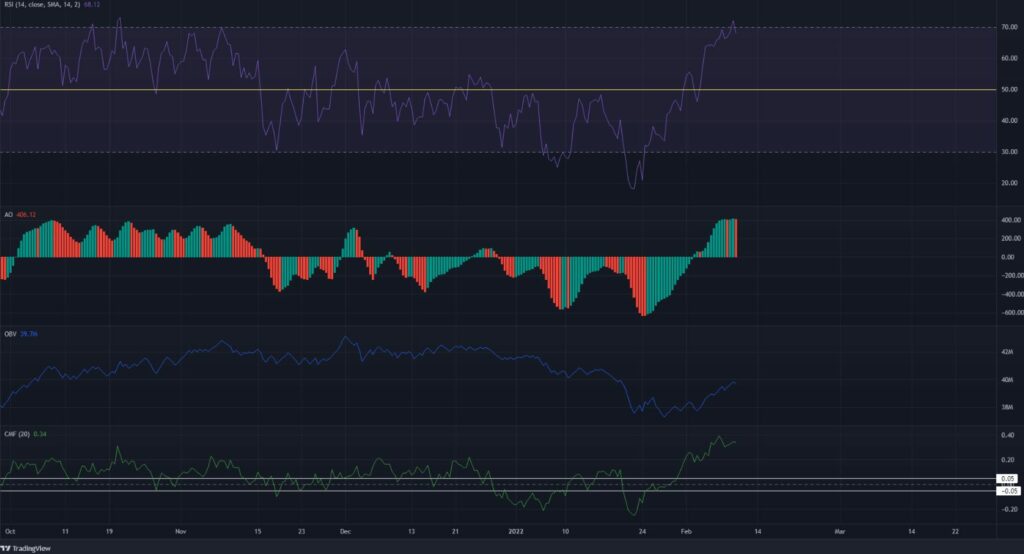
The RSI and the Awesome Oscillator on the 12-hour chart were strongly bullish, having worked in bearish territory since late November. This highlighted that the bearish control of the last few weeks could have been abandoned.
The OBV has also seen an uptick, although it did not yet undo the selling volume of the past couple of months. The CMF also showed that the past two weeks have seen strong capital flow into the market.
This evidence once again highlighted the upward momentum of the past two weeks and the increase in demand.
Conclusion
The move above $2800 showed that Ethereum is likely heading higher. But, can it attain its ATH in the months to come? Or will we need to await a deeper pullback? The evidence pointed towards the upside, and a flip of $3411 to support would be a strong statement by the bulls.
A revisit of the $2900-$3150 zone could be a good buying opportunity, provided Bitcoin does not drop below $39,000 in the meantime.