
The rapid price increase might change the shape of the market in general
Bitcoin has formed a fairly rare technical pattern on the cryptocurrency’s daily chart that could act as an overall market reversal point. The “Inverted Head and Shoulders” pattern usually appears at the bottom of a bearish rally.
How may the pattern change the shape of the market?
According to Bloomberg’s analysis, the pattern that appeared on the chart could mark the future path for the world’s largest cryptocurrency to new local highs. As the analysis suggests, the potential target for Bitcoin could be set at $53,000. If the cryptocurrency finally manages to break the neckline resistance, this scenario would come into play.
The 18% price increase would be seen as a bold move for Bitcoin, which has been in a state of correction for 100 days. Such a sharp rise would bring the price increase from the current reversal to around 53%.
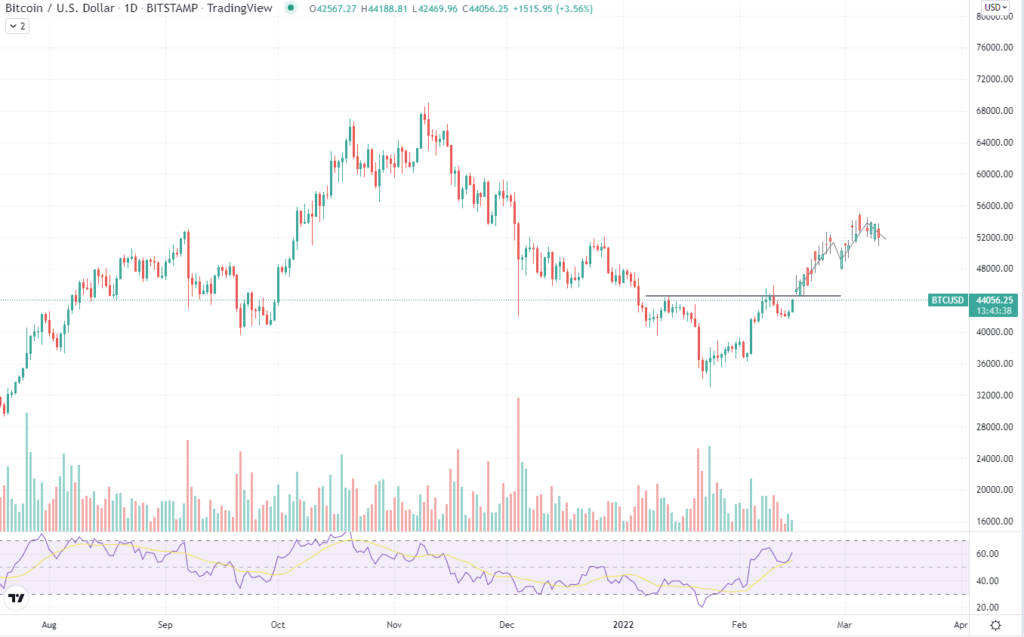
While reaching $53,000 could be considered a full reversal and exit from the correction, Bitcoin would still be trading 20% cheaper compared to its all-time high of $69,000.
How likely is the cleavage to rupture?
Although there is no way of knowing if Bitcoin will break through the aforementioned resistance line, we can always compare the technical data using indicators such as RSI and volume.
According to open interest, investors are not rushing to put their funds back to the market; hence, trading volumes are still considered lower than before, which is not a good sign for the crypto market.
As for the relative strength index, the indicator’s values are currently holding in the neutral zone, suggesting that the market has room for growth.