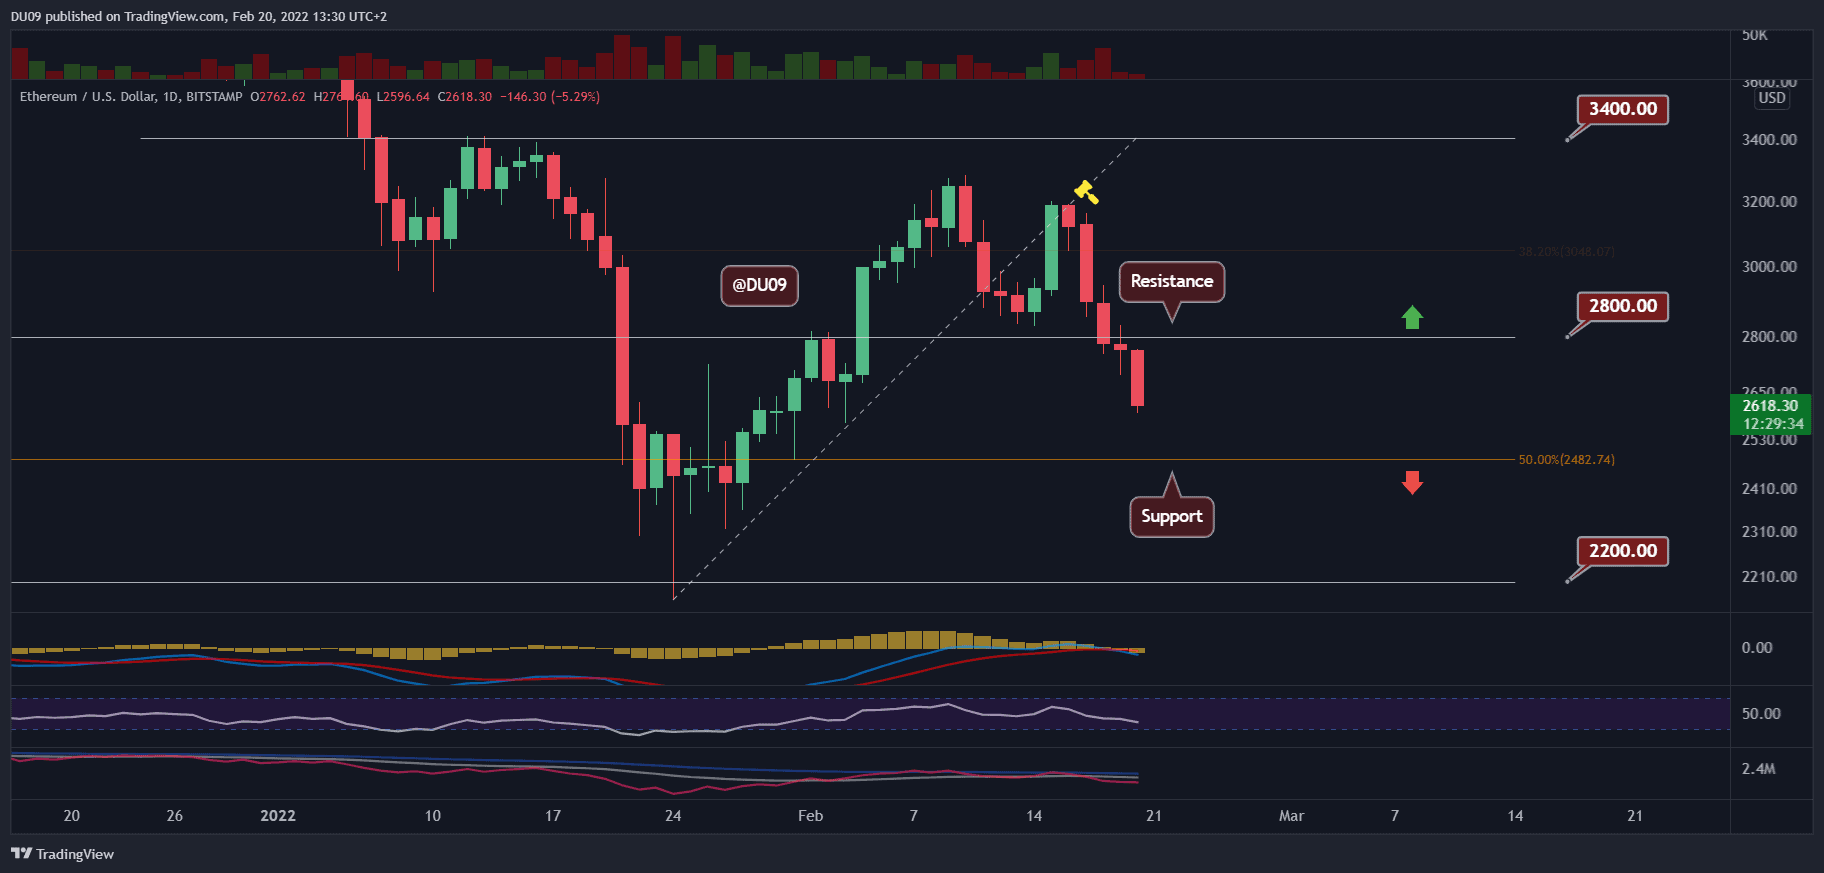
The market took a nosedive over the weekend, and now ETH is on a clear path to retest the $2,500 support. According to market data by CoinGecko, ETH has been down 4% over the past day and 18% since Thursday.
Main levels of support: $2,500, $2,200
Key Resistance Levels: $2,800, $3,000
With a bearish crossover on MACD and plummeting price, the outlook for ETH is not good. The rejection at the $2,800 resistance intensified the selling. ETH is now heading towards the key support level at $2,500.
In case the latter level doesn’t hold, ETH might take another shot at January’s low amid $2200.
Technical indicators
Trading volume: After five red days, the selling pressure was particularly strong last Friday, when the price broke below $2,800, which is a bearish sign.
RSI: The daily RSI is declining, in line with the recent price action. The RSI sits at 38 points at the time of this post, and there is still plenty of room to go lower until RSI reaches oversold conditions (below 30).
MACD: The daily MACD saw a bearish crossover yesterday, and today’s price action demonstrated that. This bearish momentum is likely to continue for some time.

Bias
The current bias for ETH is bearish. So far, support around $2,800 – $3K failed.
Short term price prediction for ETH
ETH is in a clear downtrend and looks set to retest price levels not seen since last month. The first line of defense is at $2,500, the next at $2,200. A breakdown below, and ETH will register a new low since July 2021.