
Bitcoin (BTC) has increased considerably since January 24, but has yet to confirm that it has reached a bottom.
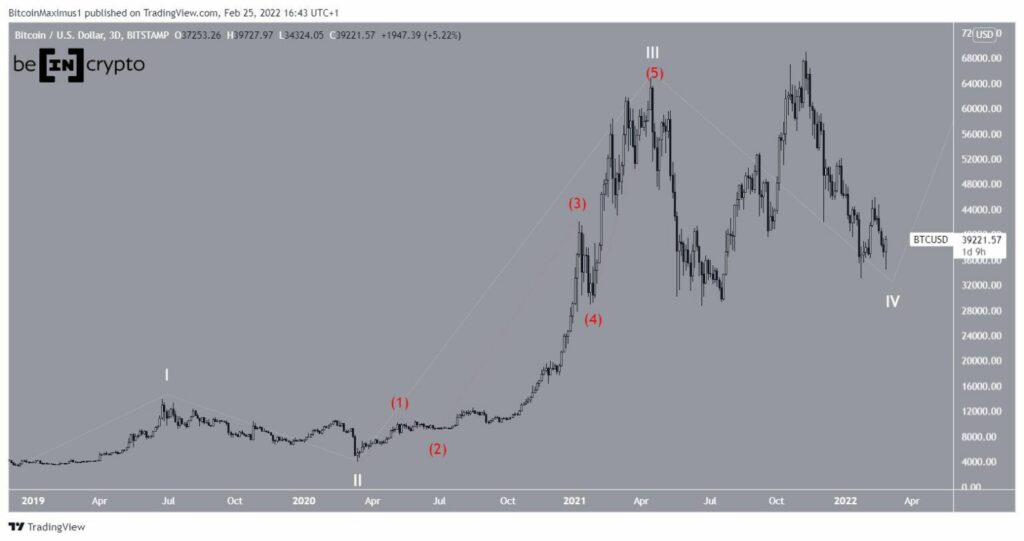
The long-term chart shows that BTC has been rising since December 2018. The most likely wave count suggests that it started a five-wave upward move (white) from a low of $3,122 at this dated. This move led to the current all-time high price. However, since April 2020, BTC has been correcting inside the fourth wave.
In this article, several possibilities for the construction of wave four will be analyzed in order to determine which is the correct count.
Number of triangles
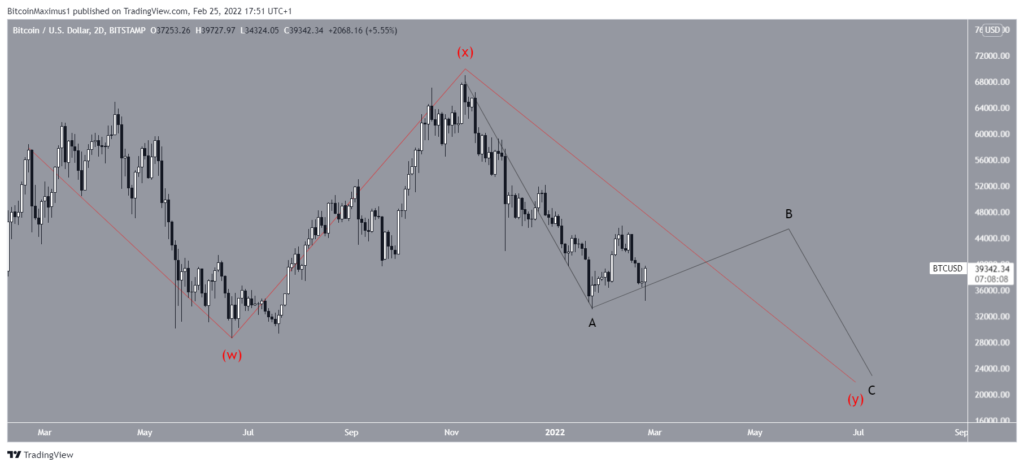
The first number of potential waves suggests that wave four takes the form of a symmetrical triangle. In this one, BTC is currently in wave D (red). In this possibility, BTC would rise towards $51,000-$55,250, an area created by the 0.5-0.618 Fib retracement support levels before another decline.
As of right now, the count is still valid.
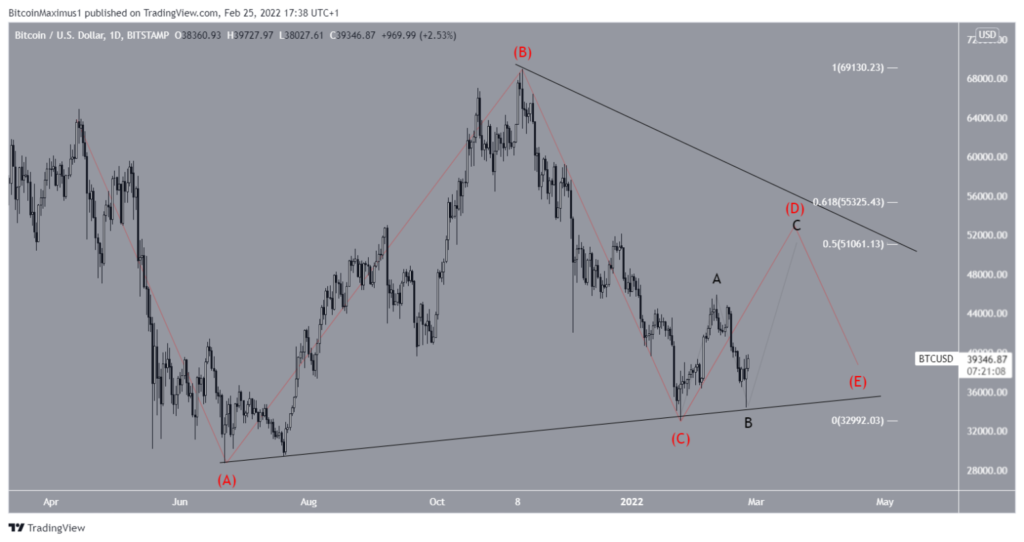
However, the problem lies in the short-term movement. The decline since Feb. 10 (highlighted) looks like a five-wave downward move (red). Therefore, this puts the whole count in doubt, since the descent should rather be a three-wave movement.
While it is possible that the structure is a very extended flat correction (yellow), the ratio between A and C is unusual.
BTC correction in progress
Trader in cryptocurrency @24kcrypto tweeted a chart of BTC, indicating that the correction is not over yet.
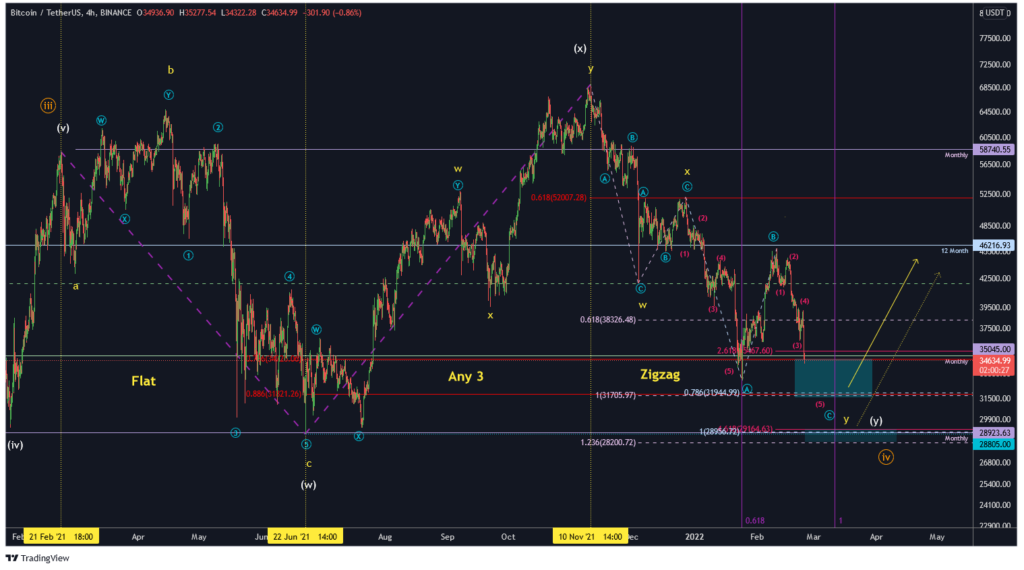
This possibility would suggest that BTC is still mired in a complex corrective structure.
The problem with this count is the very duration of the correction, which has been ongoing since April. Therefore, until it is completed, the whole structure would take more than a year.
Completed correction
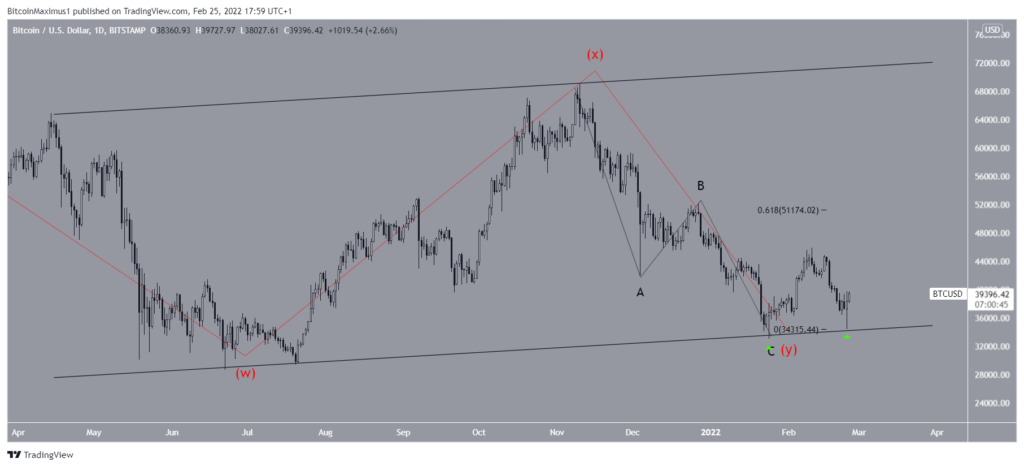
Another possible count suggests that BTC has bottomed on Jan 24. The ratios between the sub-waves (black) fit perfectly, since A:C have close to a 1:0.618 ratio.
Additionally, the entire movement is contained in an ascending parallel channel, which has so far been validated twice (green icons).
However, similarly to the triangle count, the issue here is the short-term decrease, which has so far been a five wave downward movement.
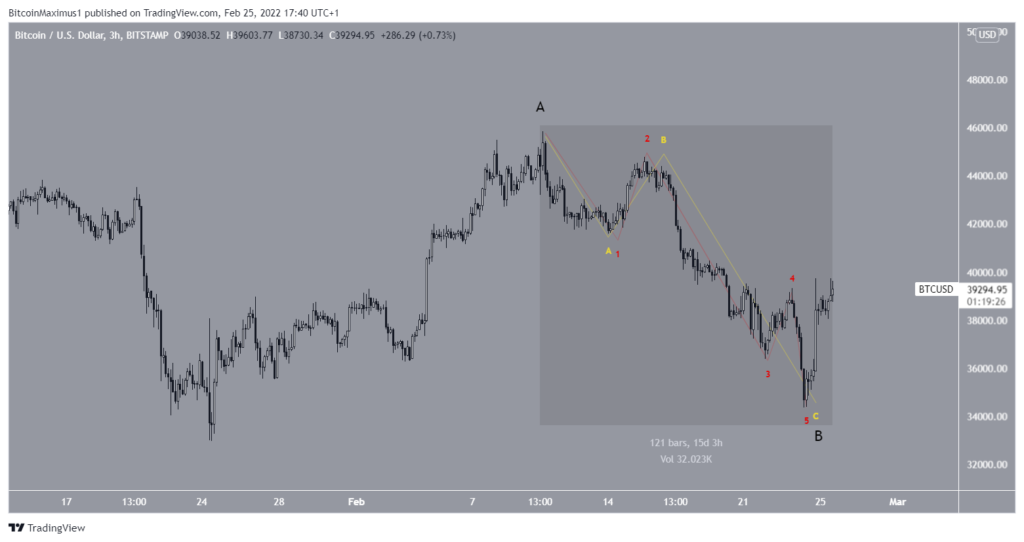
Short term BTC movement
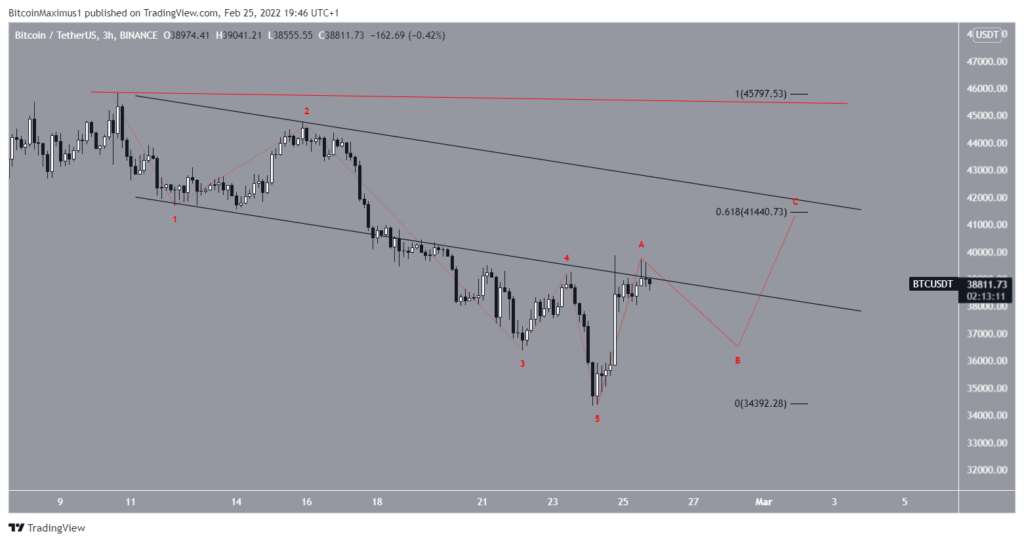
As shown above, the short-term move suggests that the decline since Feb. 10 is a five-wave downward move (red line). Therefore, what often follows is an ABC corrective structure, before another decrease.
The most likely level to act as the top of the current increase would be near $41,450. This is the 0.618 Fib retracement resistance level and would coincide with the resistance line of the previous descending parallel channel.
A rise above the February 10 high at $45,821 (red line) would instead suggest the count is bullish.
Conclusion
To conclude, there are several counts which are still valid, but all of them have some irregularities between the wave ratios. However, all the counts suggest that a bottom is very close and will likely be reached in the next few months.