Bitcoin (BTC) has broken out from a short-term diagonal resistance level and appears to be in the first steps of creating a bullish structure.
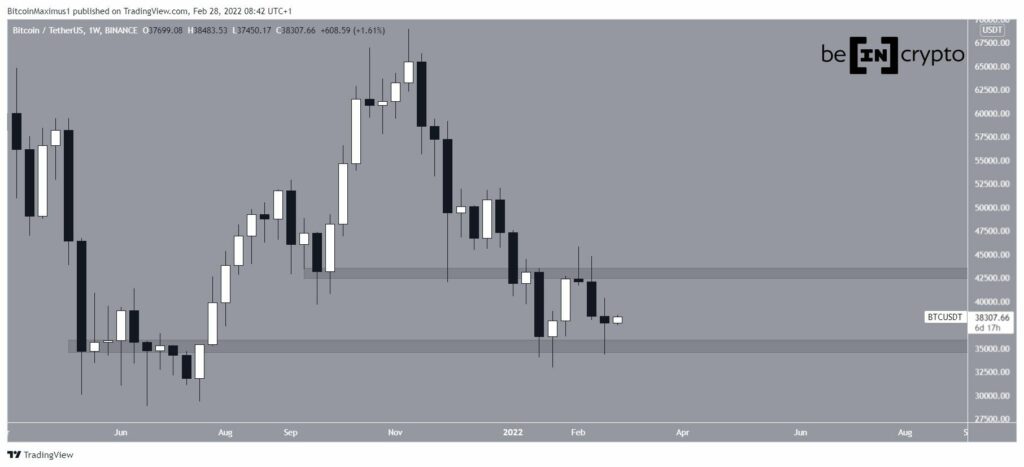
Bitcoin started the week of February 20-27 with a steep drop but rebounded soon after and created a long lower wick. Such wicks are considered signs of buying pressure.
The bounce also served to validate the $35,200 horizontal area as support.
If BTC continues to rise, the next closest resistance zone would be found at $43,000.
Ongoing BTC bounce
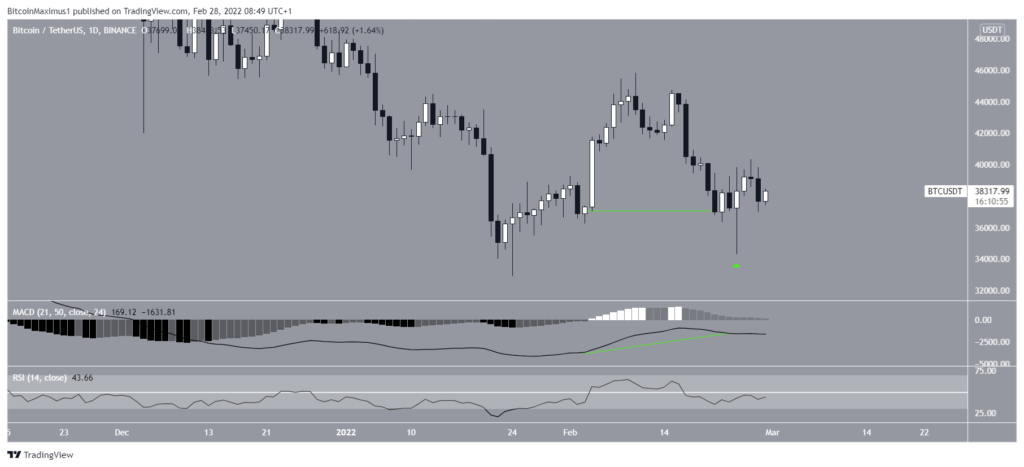
The daily chart shows that virtually the entire upward move transpired on Feb 24, when BTC created a bullish hammer candlestick (green icon) with a very long lower wick.
Despite this seemingly bullish price action, technical indicators are providing mixed readings.
The MACD and RSI are both increasing, and the former has even generated some bullish divergence (green line).
However, the MACD is still negative and the RSI is below 50. This means that despite the potential bullish reversal, none of the indicators have crossed the threshold that would confirm that the trend is bullish.
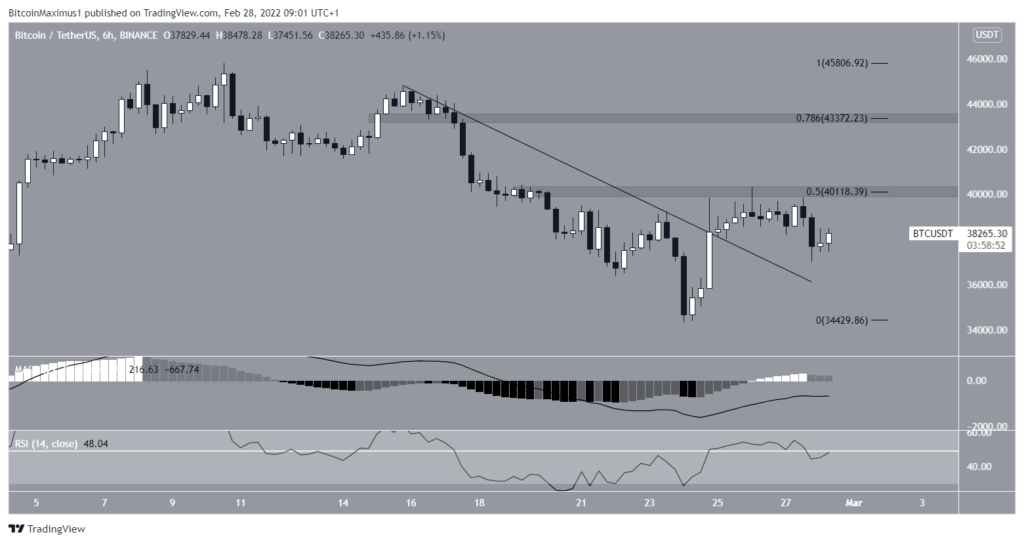
The six-hour chart shows that BTC has broken out above a descending resistance line that had previously been in place since Feb 16.
After the breakout, BTC was rejected by the resistance level at the 0.5-$40,100 Fib retracement.
However, it dropped back a bit and created a higher low on Feb 27.
Similar to the daily timeframe, the MACD and RSI rise. However, the first is always negative and the second is on line 50.
If BTC manages to move above the $40,100 resistance area, the next resistance would be found at $43,350. This target is the 0.786 Fib retracement resistance level and a horizontal resistance area.
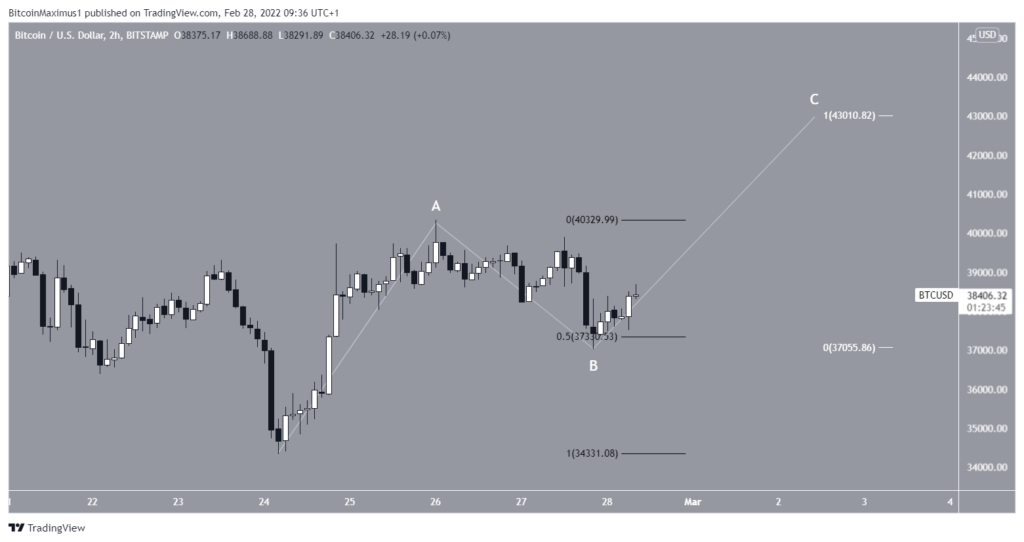
Wave count analysis
The number of long-term waves is still unclear.
However, the short-term count suggests that BTC has just completed the B wave of an A-B-C corrective structure. This was done with the Feb 24 bounce at the 0.5 Fib retracement support level (black).
If waves A and C have a ratio of 1:1, the price would increase to $43,000. This would also coincide with the long-term resistance level.
Following this, another downward move could occur.