Bitcoin’s price has been declining over the past few days, almost reverting all gains from the past greenish week. In fact, Bitcoin lost over $6K over the past 3-days.
However, there is a positive sign for bulls: despite the fear and uncertainty in the market, the divergence between long-term (accumulating) and short-term (losing) holders is much larger in this crash compared to 50% drop in May 2021.
Technical Analysis
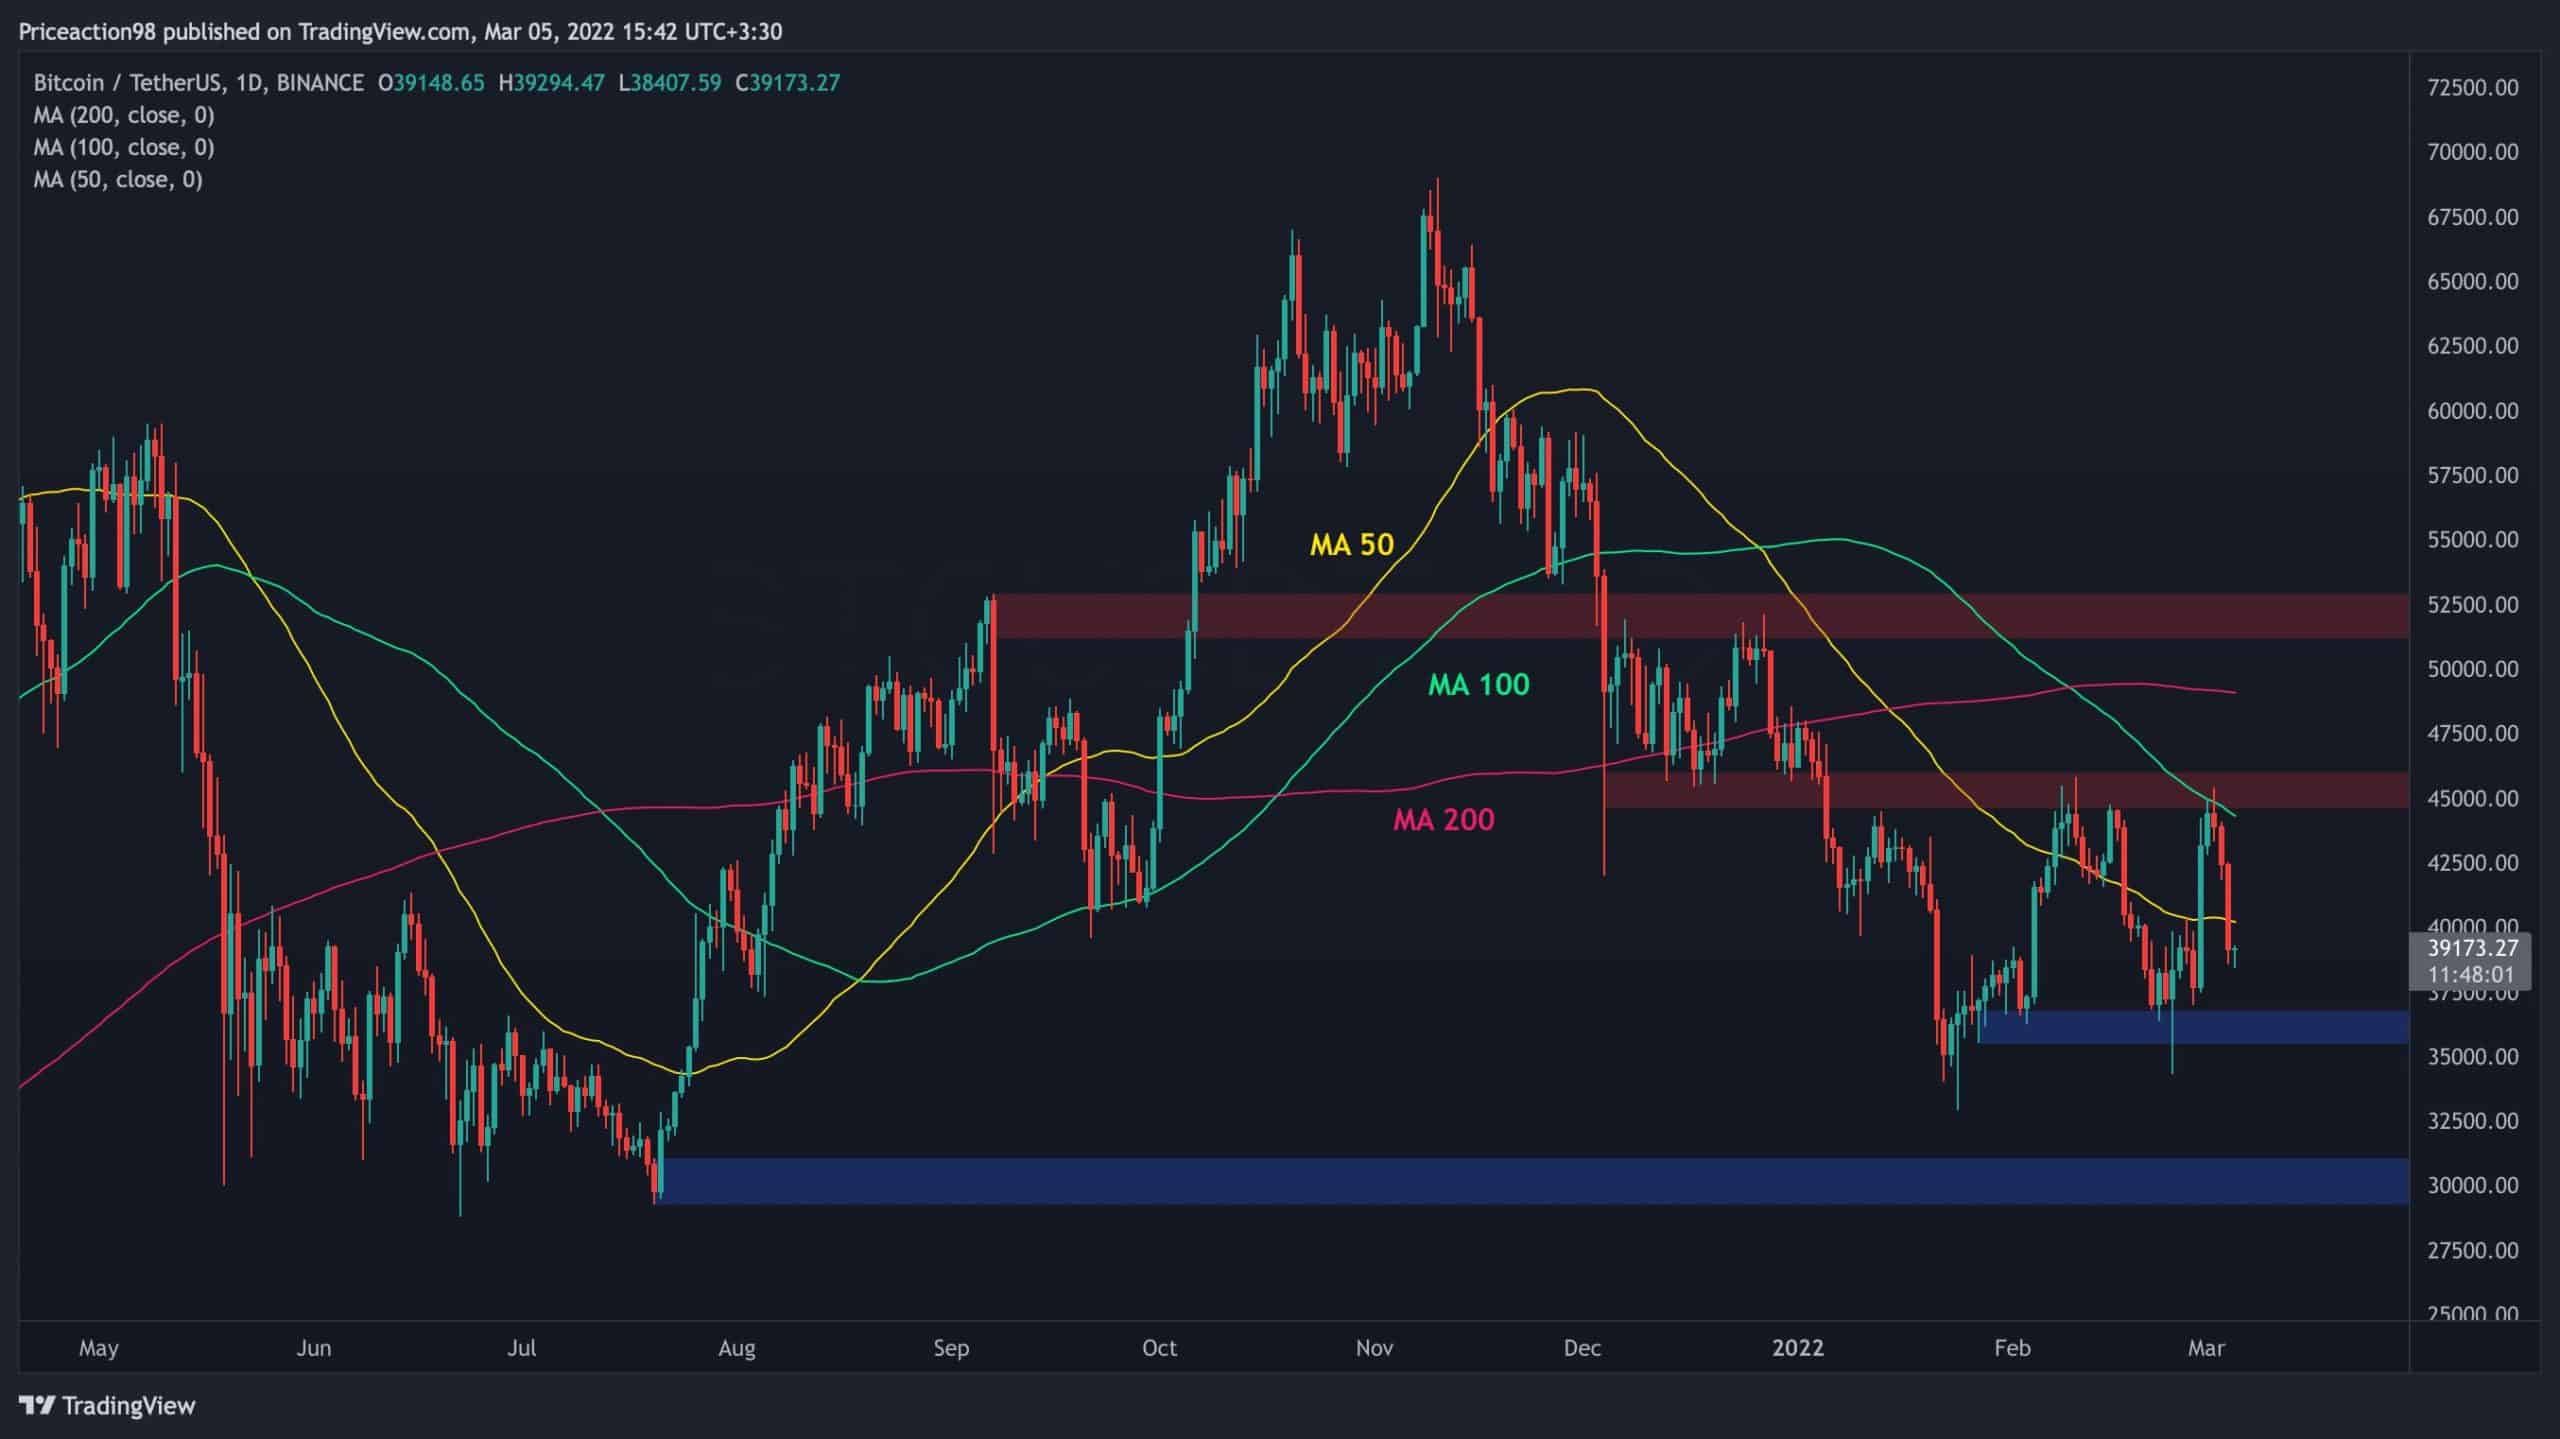
The Daily Chart
As mentioned in our previous analysis, the price has been rejected impulsively from both the 100-day moving average and the $45K resistance level.
BTC also broke below the 50-day moving average, once again spreading fear across the market. However, there is still a chance to retrace above the significant moving average line over the past few days. In this case, we might see another push towards the $45,000 resistance.
On the other hand, if BTC fails to recover in the next couple of days, the next support level would be the $36K area that the bulls defended the last time it was tested last Thursday, on the day of the Rissian’s invasion.

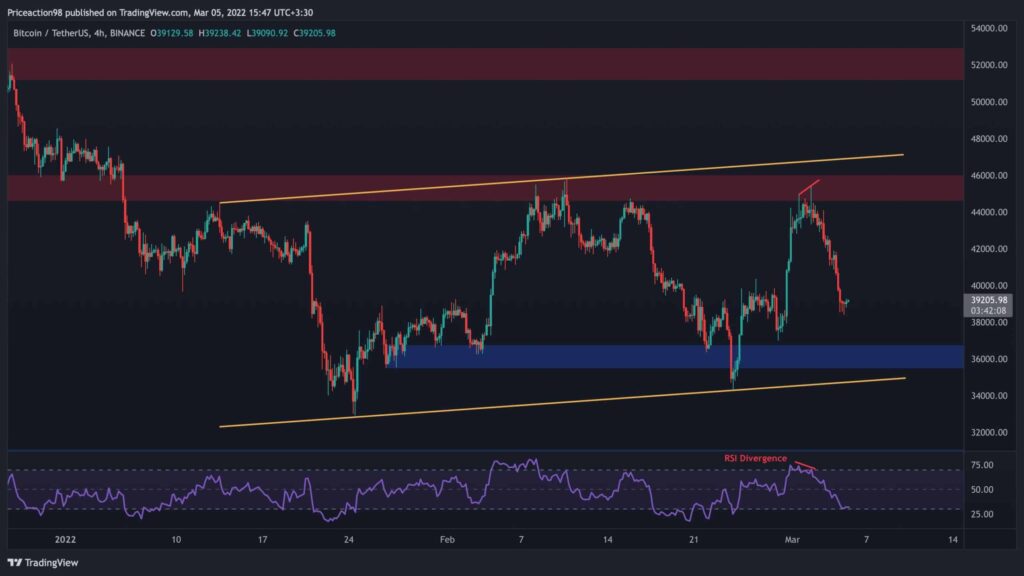
The 4 hour chart
On the 4-hour timeframe, it was evident (and mentioned here) that the uptrend was showing weakness while testing the significant resistance at $45,000, closing with huge wicks to the upside.
The RSI also indicated that the price was at ‘overbought’ at the top of the range, with values above 70.
Additionally, a bearish RSI divergence was also spotted by this oscillator, indicating a possible short-term correction. Currently, the RSI is entering the oversold zone on the 4-hour time frame, indicating that a short-term bottom may be near.
The price also seems to be creating a continuation pattern in the shape of a bearish flag, and a breakdown of the lower trendline could cause much more pain towards the $30K barrier. This pattern would be invalidated in case of a bullish breakout of the upper line.
On-chain analysis
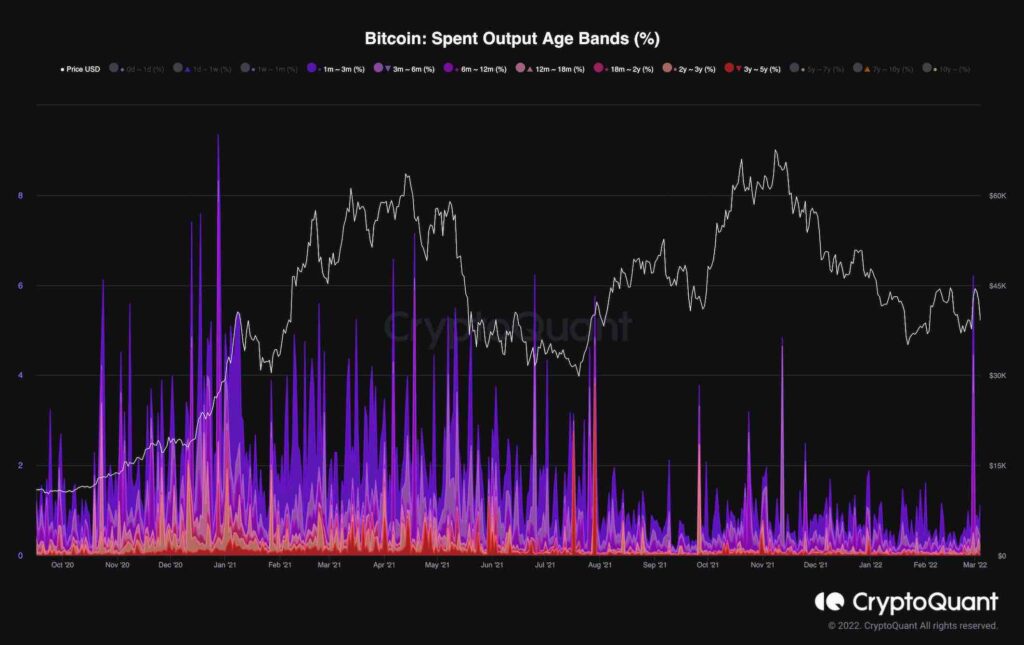
The graph below shows the age ranges of spent Bitcoin production since October 2020.
This metric is known as Spent Output Age Bands (%), and it is a collection of all spent outputs created within a specific age band. Each colored band shows the total value of spent outputs generated within the specified age band. This indicator combines the behaviors of long-term and short-term investors, combined with the price.
As can be seen, there was more activity in the early stages of the bull run in the first quarter of 2021, which means higher demand. Comparing the fall from $65,000 to $29,000 in May 2021 and the recent bearish move from $69,000 to $33,000 (Jan 2022), it can be observed that long-term investors made more profits in May 2021 .
Currently, a high proportion of the market’s activity comes from retailers, who sell their coins under psychological pressure while the long-term holders are holding and accumulating.