Bitcoin (BTC) created a slightly bearish candlestick in the weekly time frame and the majority of other technical readings remain neutral.
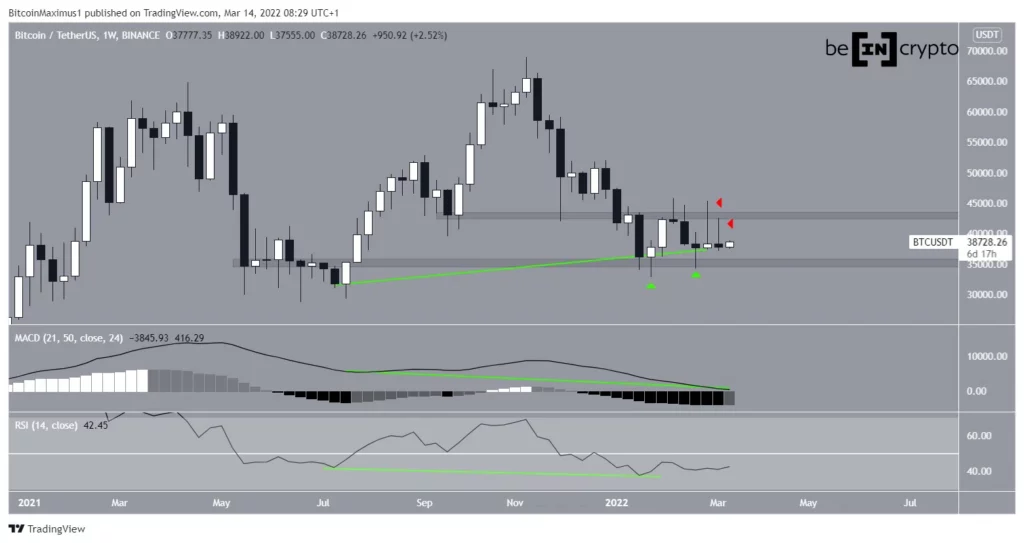
During the week of March 7-14, Bitcoin declined slightly, closing around $700 below its opening price. More importantly, it created a second successive upper long wick (red icon).
Such wicks are considered signs of selling pressure and served to validate the $43,000 area as resistance. Conversely, the closest support area is found at $35,200, created by the long lower wicks seen in January and February (green icons).
Technical indicators on the weekly horizon are mixed. While the RSI and MACD are falling, they have also generated very large hidden bullish divergences. Such divergences are often seen as signs of trend continuation.
BTC follows ascending support line
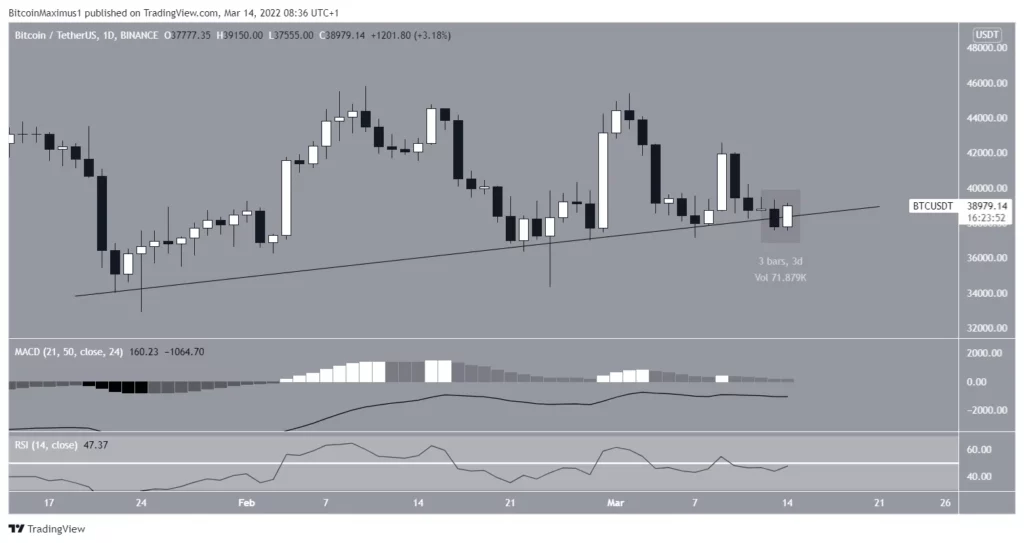
The daily chart shows that BTC has been following an ascending support line since Jan. 22. The line has been validated numerous times thus far.
BTC fell below support on January 13, but is currently creating a bullish engulfing candlestick and recovering the line. Besides being a bullish candlestick pattern, recovering the line after deviating below it would be a strong bullish sign if it happens.
However, similar to the weekly time frame, technical indicators are mixed. Both the RSI and MACD have a neutral slope. In addition to this, the RSI is at 50 while the MACD is close to the 0-line. Both of these readings are considered neutral.
Short-term movement
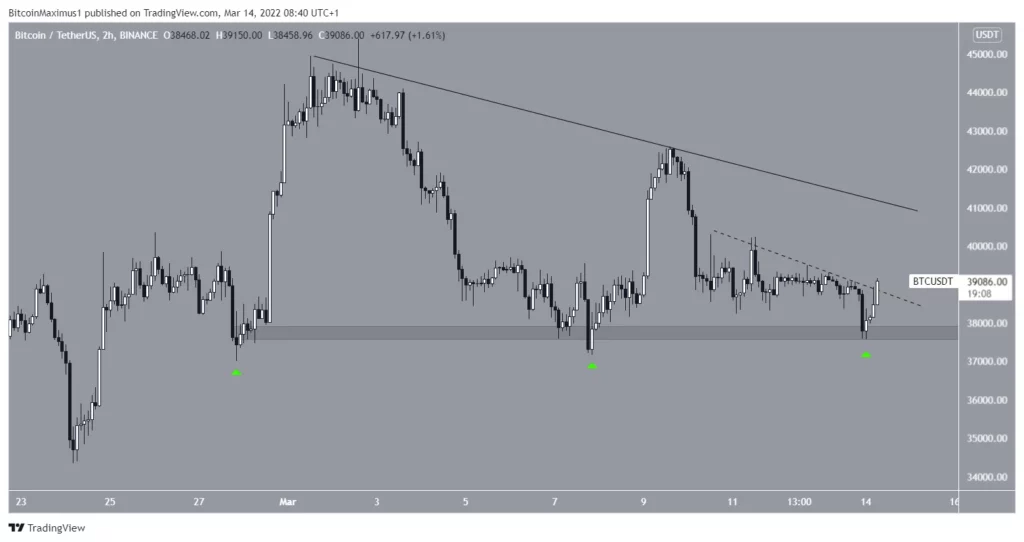
Finally, the two-hour chart shows BTC bouncing back from the $37,750 minor support zone (green icons) for the third time.
Currently, it’s in the process of breaking out from a short-term descending resistance line (dashed). If successful, this would likely lead to an increase towards the longer-term descending resistance line near $41,000.
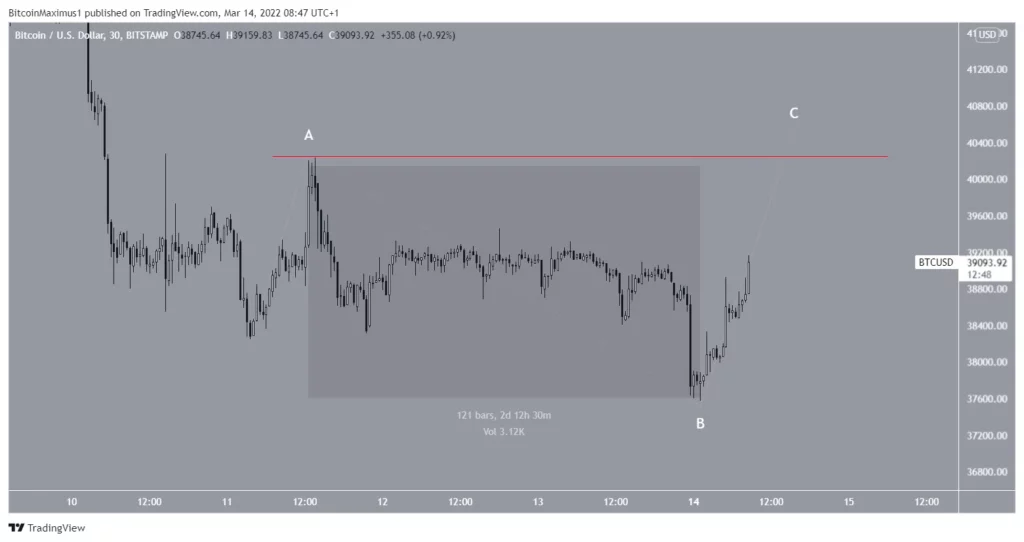
The longer term trend is still uncertain.
Due to the decrease since March 11 being a three-wave movement (highlighted), it’s possible that the entire move is part of an A-B-C corrective structure.
Therefore, a spike towards wave one at $40,237 (red line) or just above seems likely.