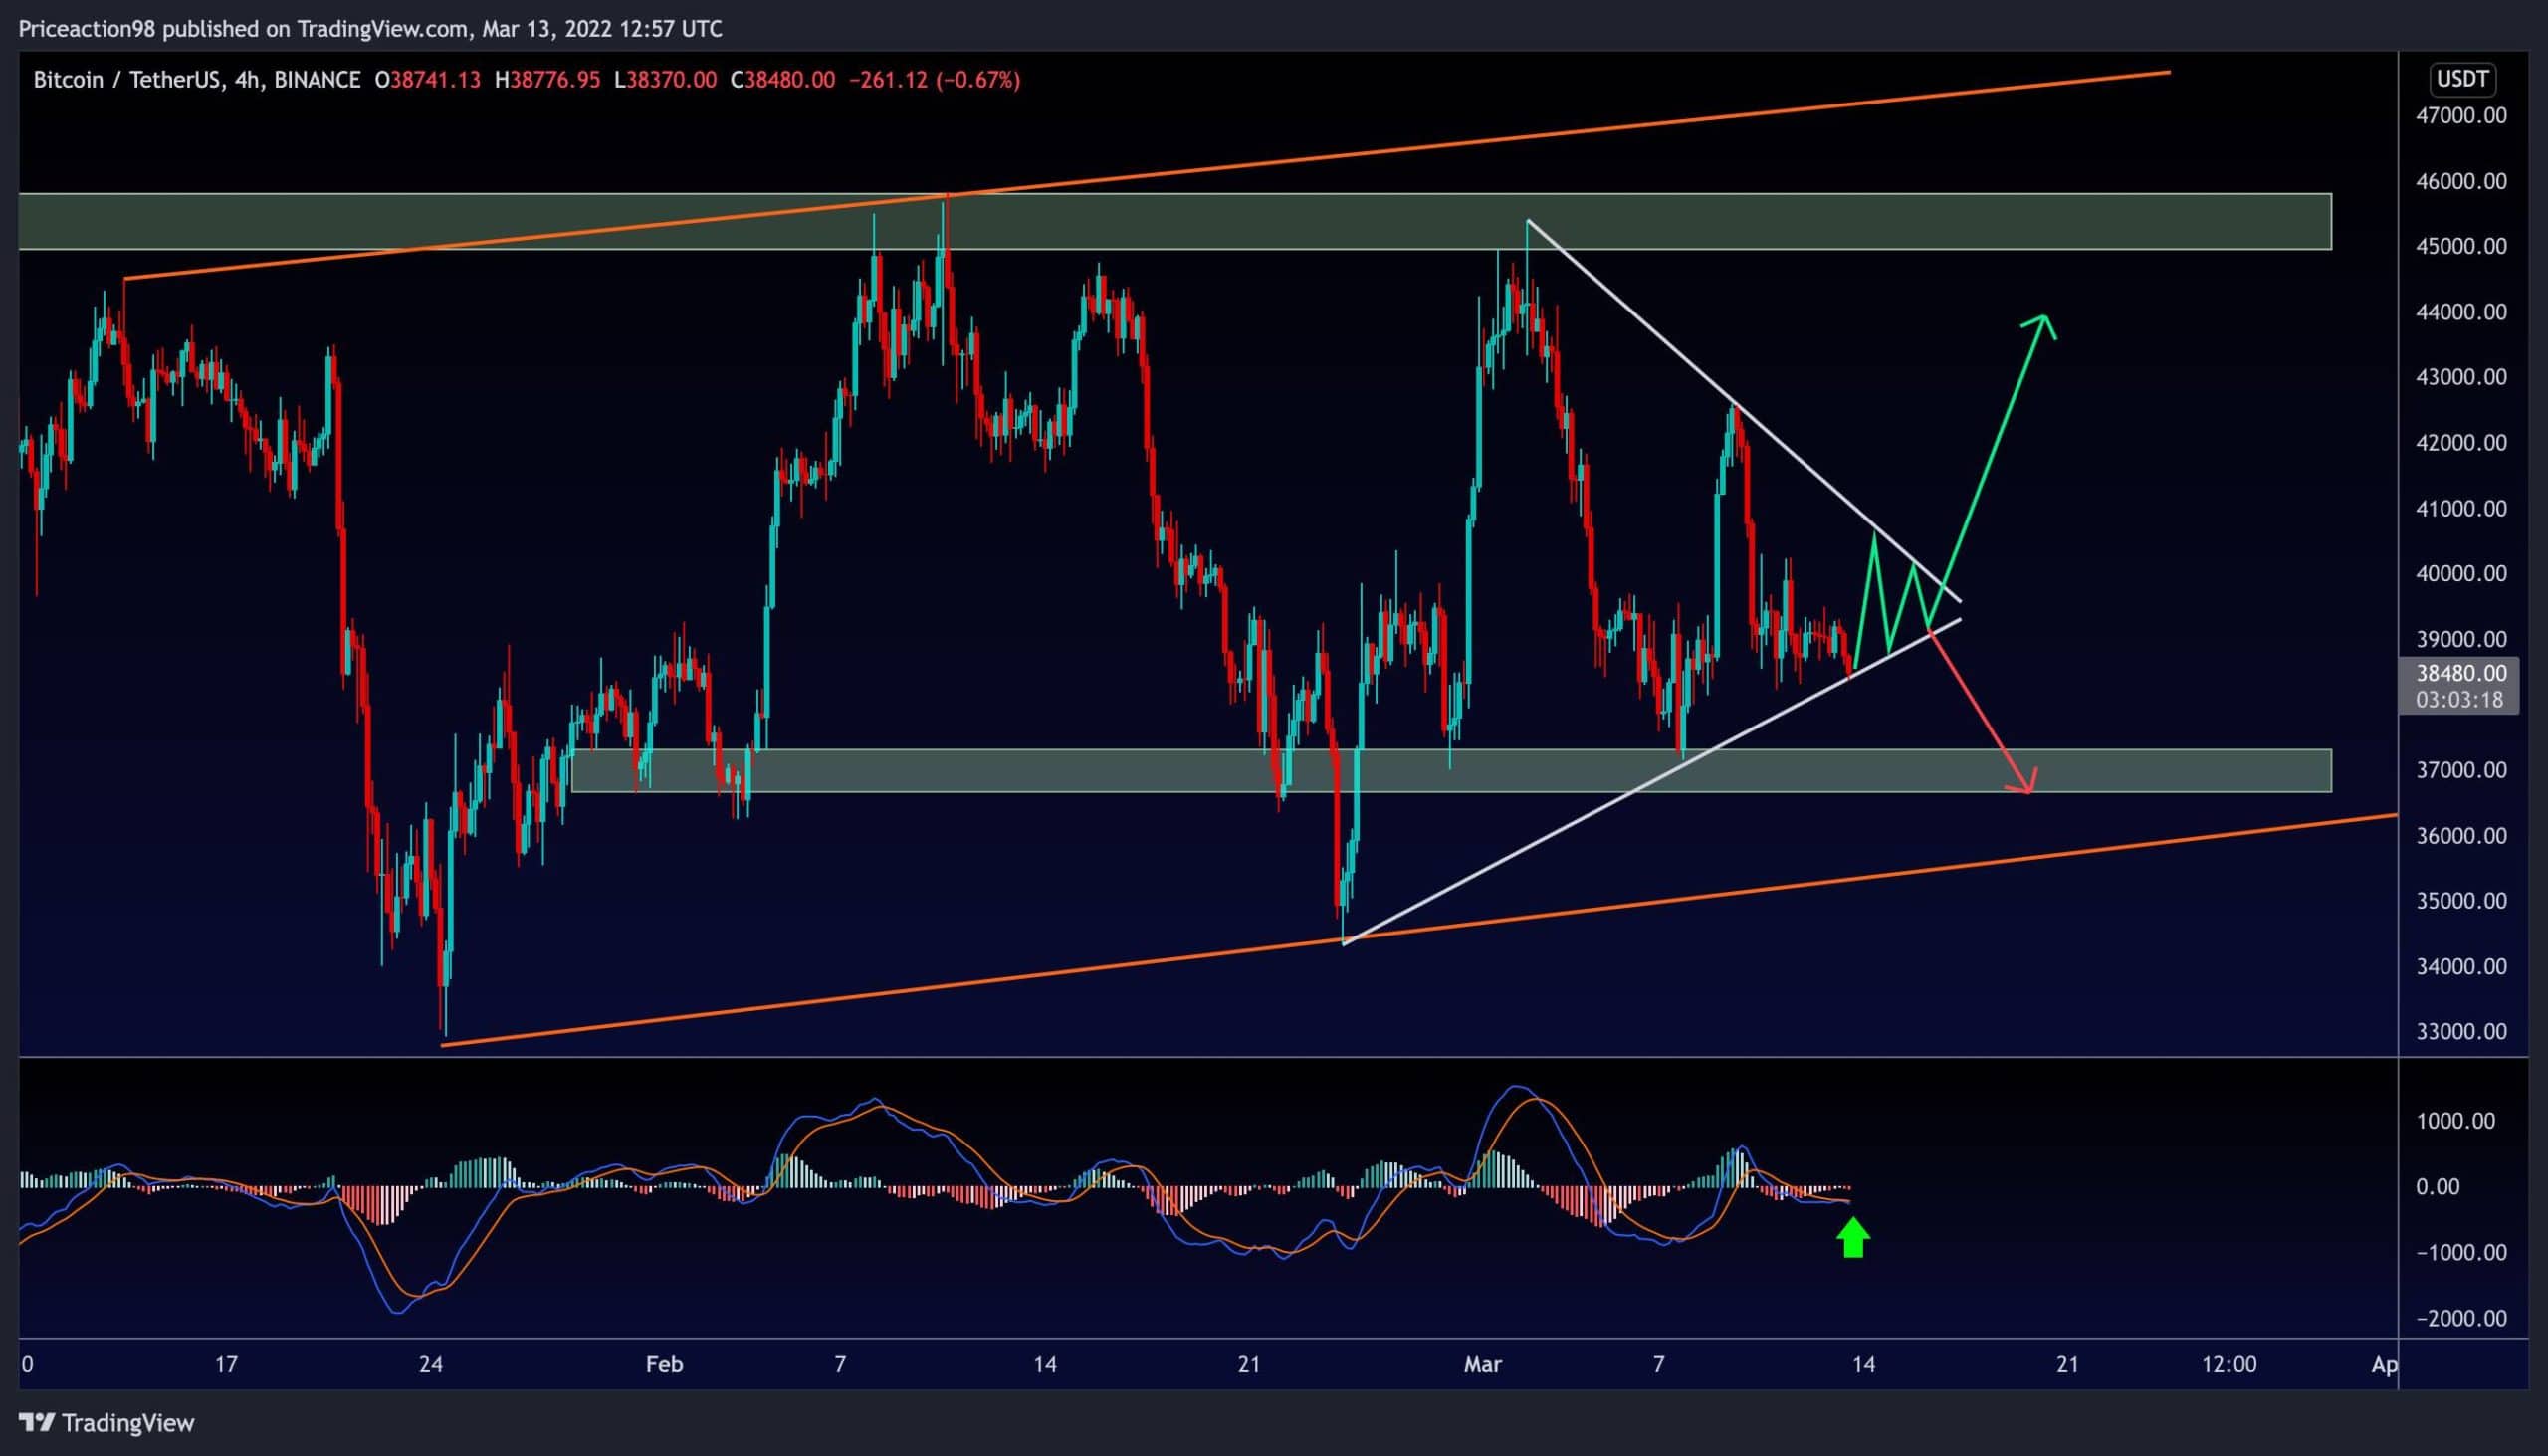
Since January 2022, Bitcoin has been experiencing significant volatility. The following chart shows an evident supply zone at the $45-46K price area, marking it the range’s top and the main barrier for the BTC price to reach out for a possible retest of the $50-60K channel.
On the other hand, a distinguished demand zone in the $33-35,000 region marks this area as the lower consolidation boundary.
The Daily Chart
Currently, the price stabilizes above the $37K mark, which turned into the crucial short-term support level. Given the current state of global uncertainty and the existing fear in the market, there is a considerable possibility that bitcoin price will continue to consolidate between these two supply and demand zones, with substantial volatility.

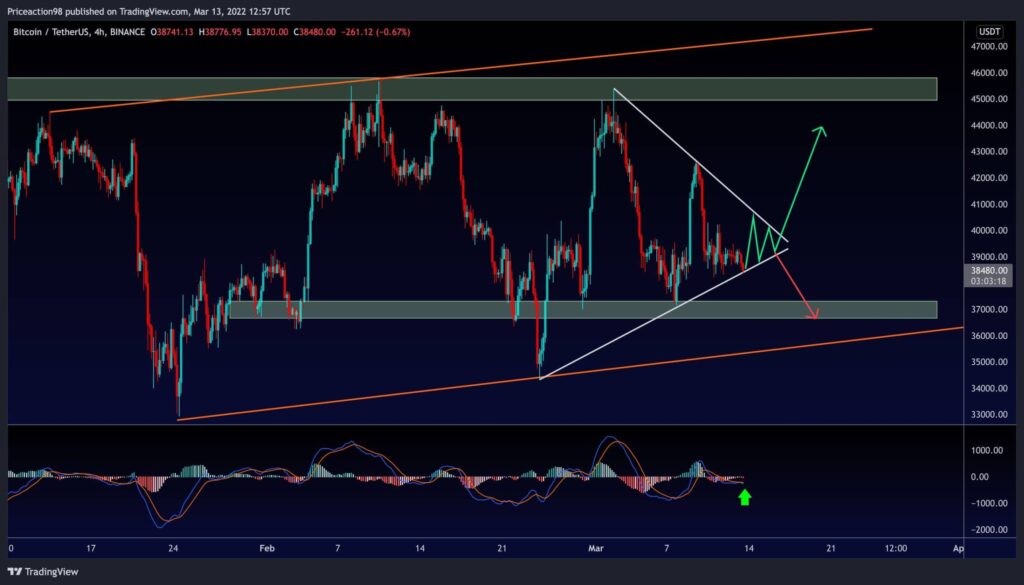
The 4 hour chart
In the shorter term, the mentioned volatility is self-explanatory. Recent price action indicates a balance between bears and bulls at the moment.
As the chart shows, bitcoin moves inside a symmetrical triangle pattern. As the price approaches the apex, it will either break through the upper trendline for a bullish breakout or break below the lower trendline for a bearish continuation.
A break above/below a triangle pattern can be seen as a potential bullish/bearish signal, especially if followed by high volume. Therefore, bitcoin will soon test the $37,000 support level if the lower trendline is broken.
Furthermore, the MACD indicator is about to turn positive, increasing the probability of an imminent bullish breakout.
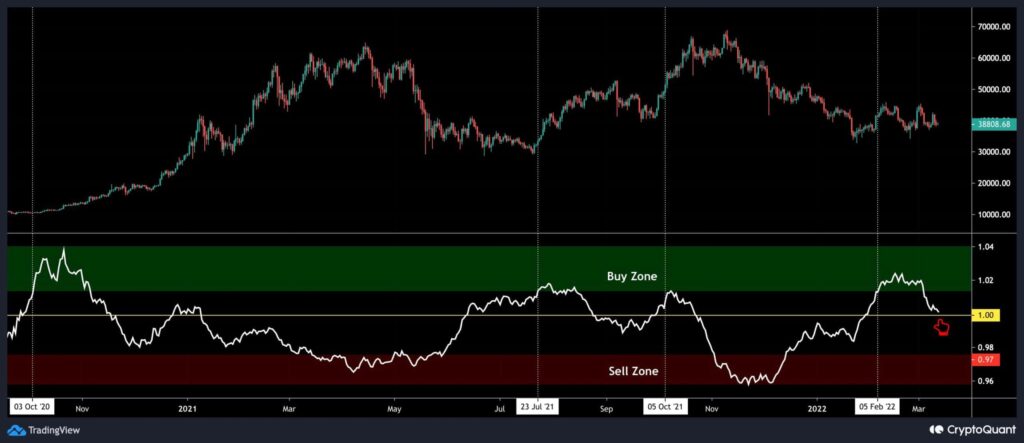
On-chain analysis
The Taker Buy Sell Ratio is depicted on the following chart, indicating whether buyers or sellers are more aggressive in the order book. Values above 1 imply intense demand in the perpetual futures market, while values below 1 suggest selling pressure.
This indicator showed values above one throughout the recent swing from $33K to $46K, which could be construed as intense demand. However, the price has not been rising considerably this time, which might be a bearish indication. Furthermore, demand appears to be diminishing as this indicator is heading lower towards 1.