
As the bulls reinforced their vigor over the last few days, the global crypto market cap finally closed above the $2 trillion mark. Consequently, the king alt continued its up-channel trajectory and aimed to overturn the $3,100 mark.
Dogecoin posted an overbought position on its short-term technicals and asserted a bearish divergence with its RSI. Additionally, Solana saw a classic EMA ribbon swing in favor of bulls while his CMF could see near-term failure.
Ether (ETH)
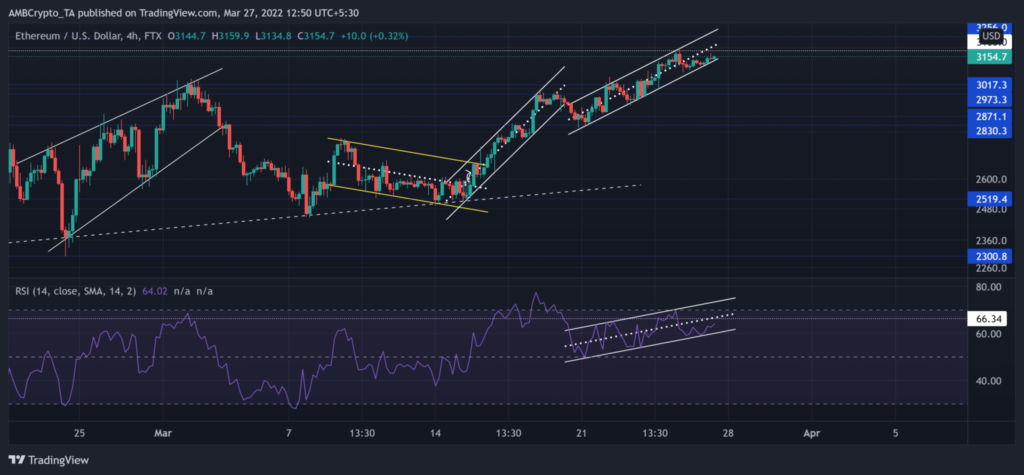
During its previous descent, ETH lost the crucial $3,200-mark while the bears flipped this level to resistance. The bearish phase led ETH to lose more than half its value as it fell towards its six-month low on 24 January.
While the bulls have kept the $2,300 base intact, the alt has risen almost 46% over the past two months. Recently, ETH bounced off its two-month trendline support (white, dotted) and witnessed two ascending channels on its 4-hour chart. Now, the immediate hurdle for the bulls was near the $3,183 mark.
At press time, ETH was trading at $3,154.7. After a recent reversal from the equilibrium, the RSI bounced back in an up-channel. After depicting a visible bullish edge, it aimed to test the 66-mark ceiling.
Dogecoin (DOGE)
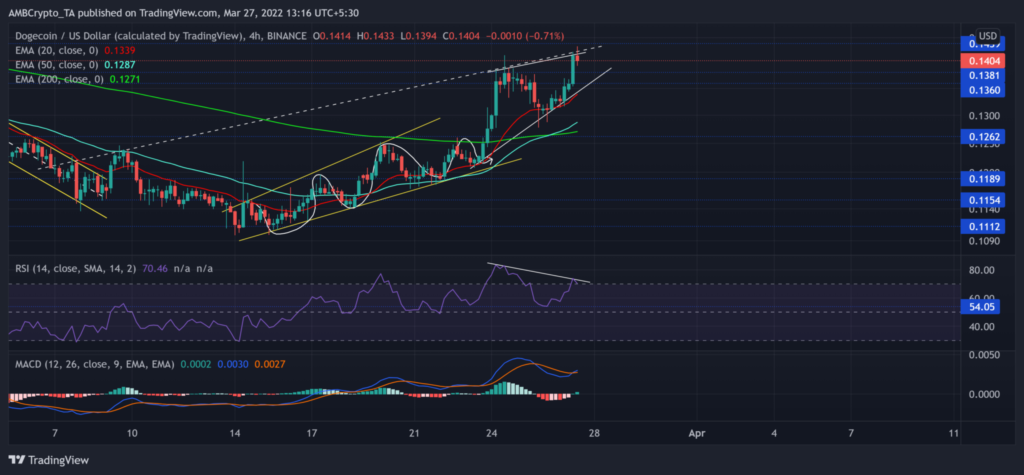
After rising from the $0.13 mark to match its February lows, DOGE rallied into an ascending broadening wedge (yellow) on its 4-hour chart. The alt has seen an ROI of nearly 27% over the past 12 days while reclaiming vital support at $0.13.
Its recent rally pushed DOGE above the 20/50/200 EMA as the bulls steered the trend in their favor. Now, the three-week trendline resistance (white, dashed) stood sturdy in the short term.
At press time, DOGE was trading at $0.1404. the IRS continued its gradual retracement from the overbought mark while holding the support at 54. Now it has seen a bearish divergence with the price. This trajectory hinted at a possible short-term decline. During this time, the MACD the lines saw another bullish crossover as the buyers showed their increased strength.
Solana (SOL)
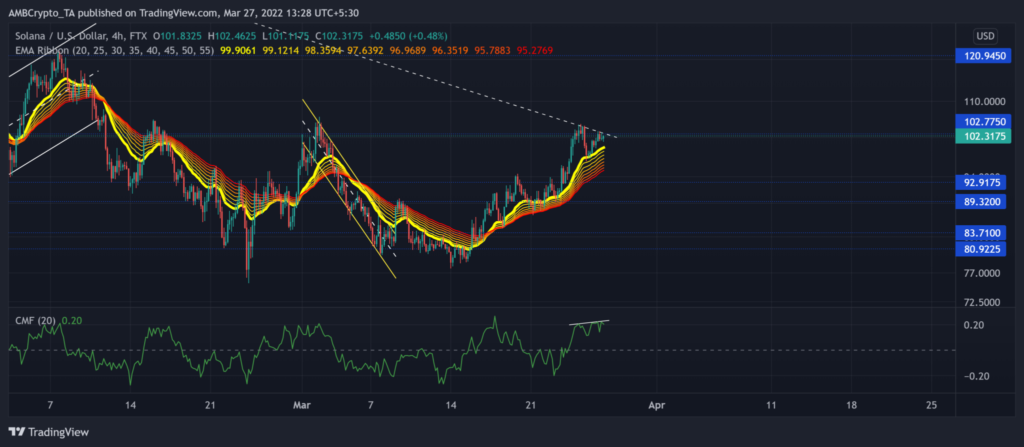
SOL saw a nearly 57% loss since the beginning of the year and touched its six-month low on 24 February. Since then, it saw an over 40% jump toward its $102-resistance.
However, this resistance coincided with the four-month trendline resistance (white, dotted). Thus, the recovery from the $80 low could not trigger a trend-altering rally. But with the EMA tapes turning bullish, the buyers were still in control.
At press time, SOL traded at $102.32. After testing the midline multiple times, the CMF finally saw a revival towards the $0.20 level. Also, CMF observed a hidden bearish divergence with the price. This reading entailed a probable near-term setback.