It finally happened: After four failed attempts during the first months of 2022, Bitcoin managed to overcome the critical resistance line at $46K and the hope returned to the market.
As the bears struggled to defend this area, the bulls were able to take control by liquidating over $400 million in open positions. Most of the indicators are now in the bullish zone.
The Daily Chart
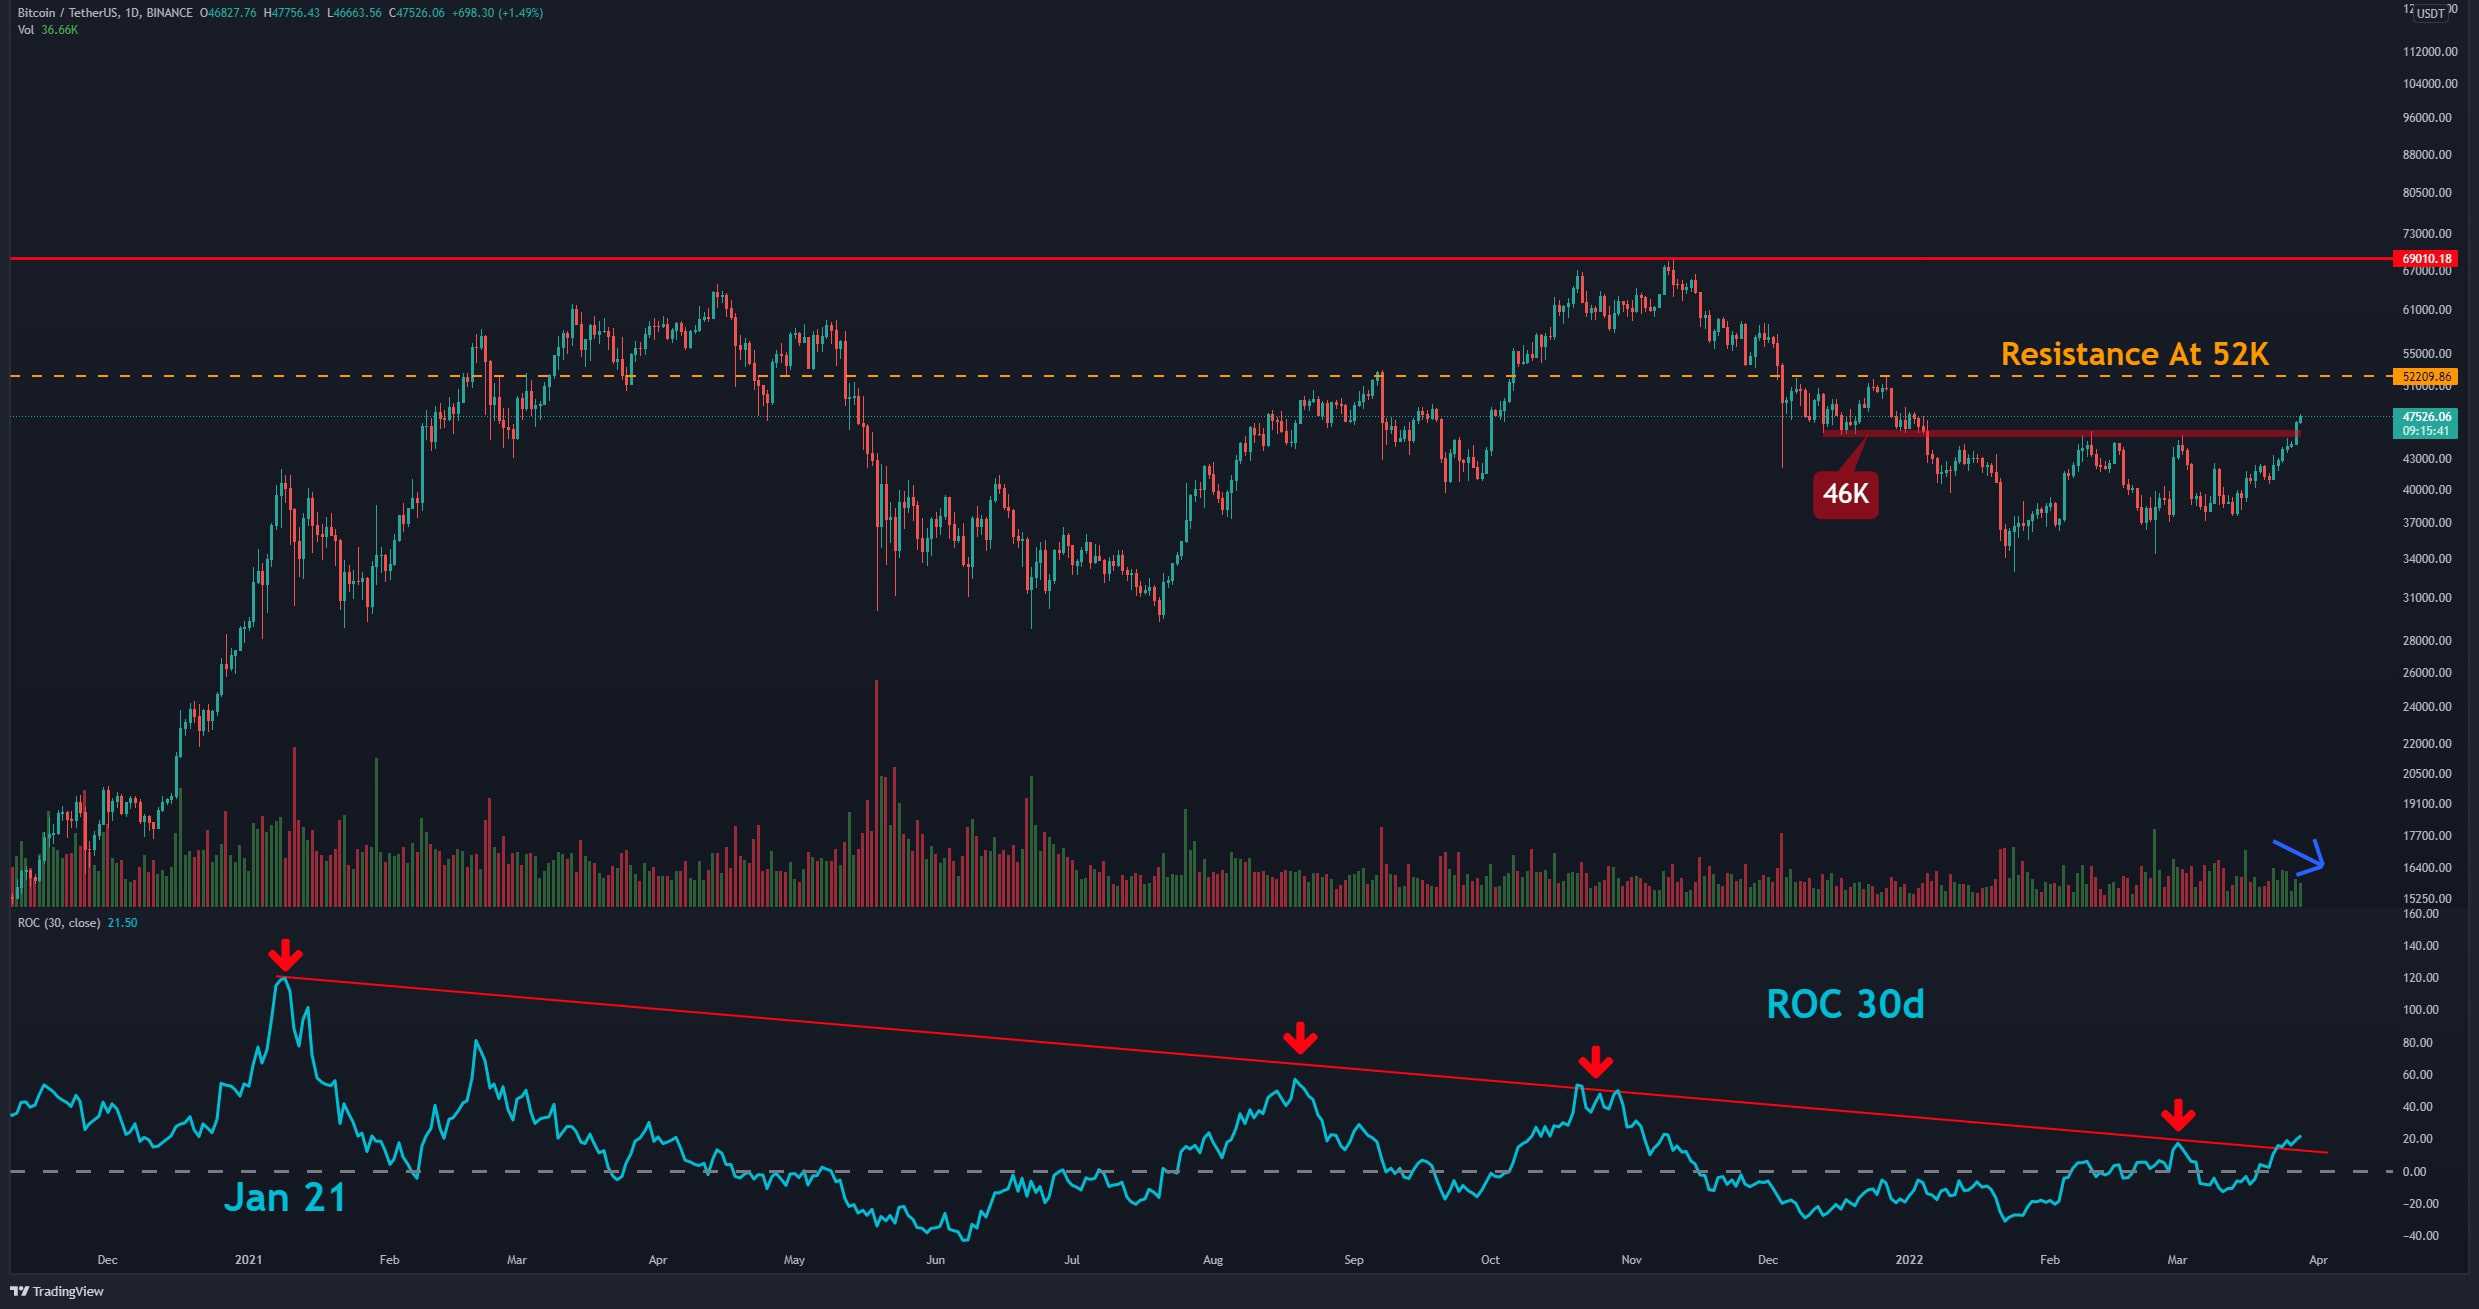
On the daily timeframe, the ROC 30d indicator was able to break above a descending trend line (marked by red) after more than a year and left market participants optimistic about the short-term future.
Breaking above the resistance at $46,000 and consolidating above it, along with the formation of a higher high, technically confirms the recent downtrend reversal.
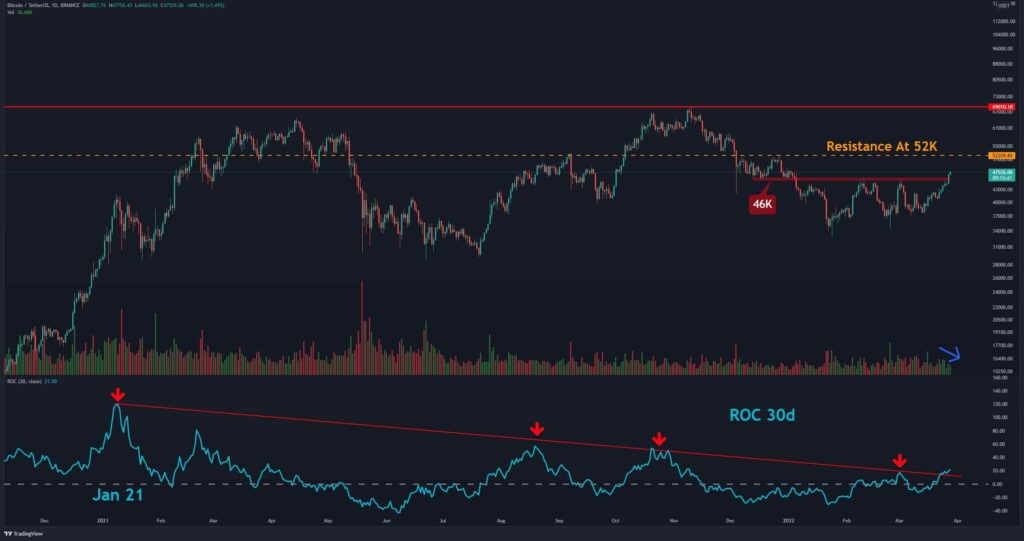
However, the trading volume is still low (marked by blue), and it is the only concerning element. Under healthy market conditions, the trading volume increases as the price rises.
Looking ahead, if the bulls can persist higher, the first major resistance lies at $52,000.
On the other hand, daily support levels lie at $46k & $42.5K
Moving average exponential levels:
EMA20: $41.8,000
EMA50: $41.2,000
EMA100: $42,000
EMA200: $48.2,000
The 4-Hour Chart
On the 4-hour timeframe, Bitcoin has reached a short-term resistance at $48K (marked by red), which is in line with the EMA-200 on the daily timeframe.
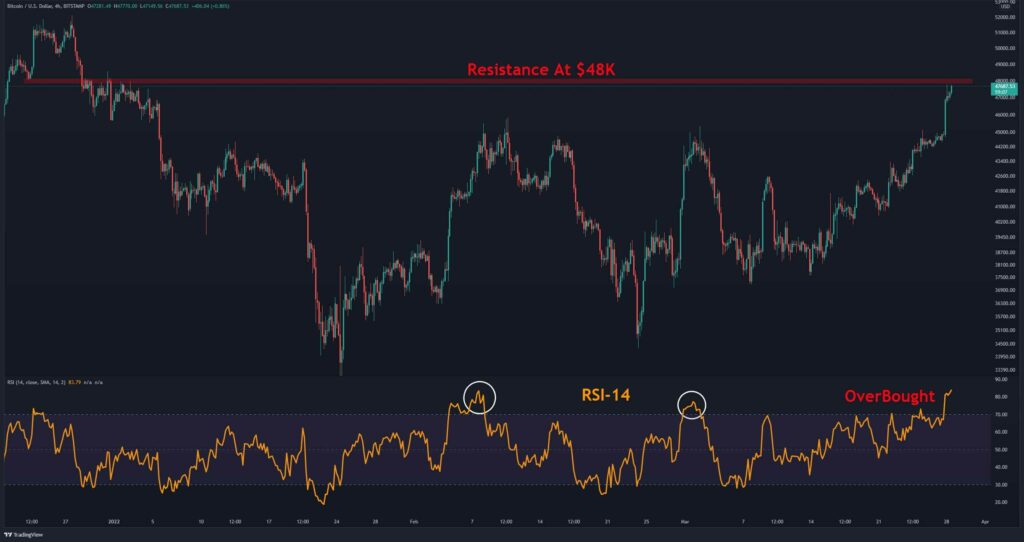
The RSI-14 indicator is also entering the overbought zone, which suffered a relatively deep correction twice when it happened before. It is better to be a little careful before going into the market.
Short-term Support Levels: $46K & $44.7K
Short term resistance levels: $48,000 and $49,500
On-chain analysis: Exchange Inflow CDD (SMA14)
Coin Days Destroyed (CDD) of coins destroyed by flowing into exchanges.
High values indicate that more long-term holders moved their coins for the purpose of possible selling.
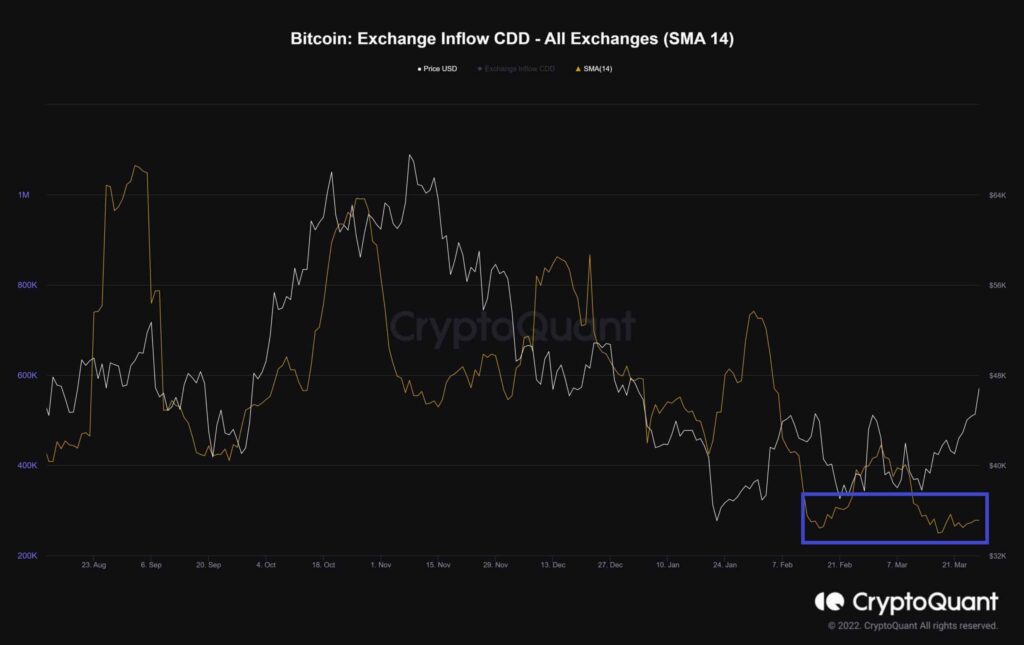
As we can see in the chart above, this metric has bottomed out after the all-time high, indicating that long-held coins are moving in lesser amounts, reducing the selling pressure from holders to long term.
It is clear that when long-term holders moved their bags into exchanges, the selling pressure has increased drastically and we have witnessed a correction shortly after. This is demonstrated by the local tops on the chart.
Minors Position Index (MPI) (SMA 14)
The Miner Position Index (MPI) is the ratio of total miner outflows (USD) to its one-year moving average of total miner outflows (USD). A higher value shows that miners are sending more coins than usual, indicating a possible sell-off.
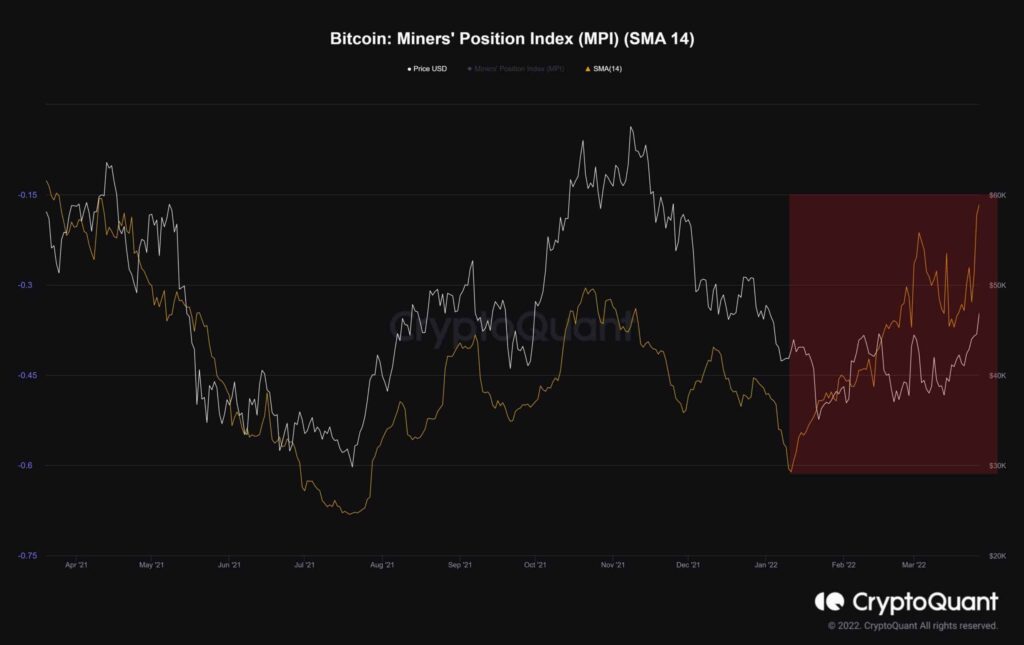
If the miners send some proportion of their reserves simultaneously, it could trigger a price drop.
Now, this is a sign that traders should be a bit more careful and have a plan for every market move beforehand.