
One of the strongest technical indicators on the market shows interesting signal for ADA
Despite degraded performance in recent weeks, Cardano remains one of the most fundamentally attractive projects in the cryptocurrency market as the network is still in full development, especially with the booming number of DeFi projects and NFT collections. This time we noticed an interesting signal that one of the technical indicators is showing on a daily chart for ADA, provided by TradingView.
As the Relative Strength Index indicator suggests, ADA’s price moves with divergence from the indicator: while the RSI moves sideways, Cardano seems to move downward in the same period. Such divergence is usually considered bullish and may hint at a price reversal in the future.
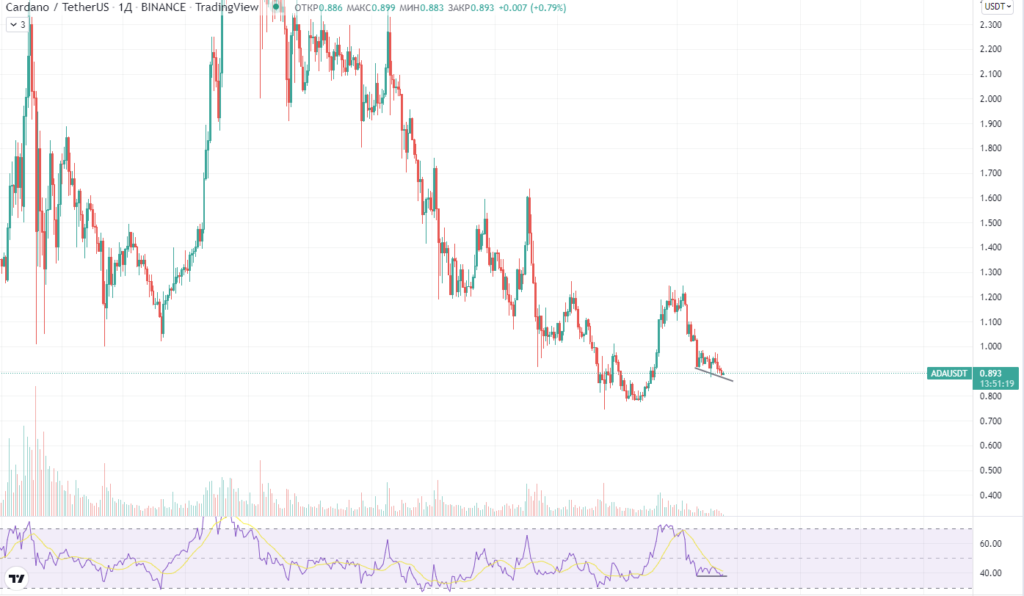
The problem with this fairly rare signal is that such a divergence is also considered “weak” and is well below the 70% hit rate. But at the same time, it can become the foundation for a stronger divergence which may have a better chance of materializing in the market.
As for the regular data of the indicator, it reaches the “oversold” zone caused by the 20-day downtrend, which brings an almost 30% loss to Cardano investors that may have purchased the asset close to $1.2.
ADA remains in the long-term downtrend that started after the “smart contracts” rally sparked by the announcement of new technology for the Cardano ecosystem. For now, developers are actively building new solutions and platforms for the Cardano ecosystem, which has already fueled ADA’s strong TVL growth to $300 million in less than a month.