
It’s been six months or roughly 180 days since bitcoin reached an all-time high at $69K per unit on November 10, 2021, and bitcoin’s USD value is down 45% from that point. Typically after bitcoin’s price tops, the bear market that follows leads to a large 80% or more decline in value. However, because the recent price top resembles the growth from April 2013 to November 2013, bitcoin’s current bearish decline may not be so large this time around.
An 80% drop from Bitcoin’s high would lead to $13,800 per unit
Bitcoin markets have been bearish for the past six months after hitting the crypto asset’s all-time high (ATH) at $69,000 last year. While prices are bleak for many, people are wondering how long the down cycle will last.
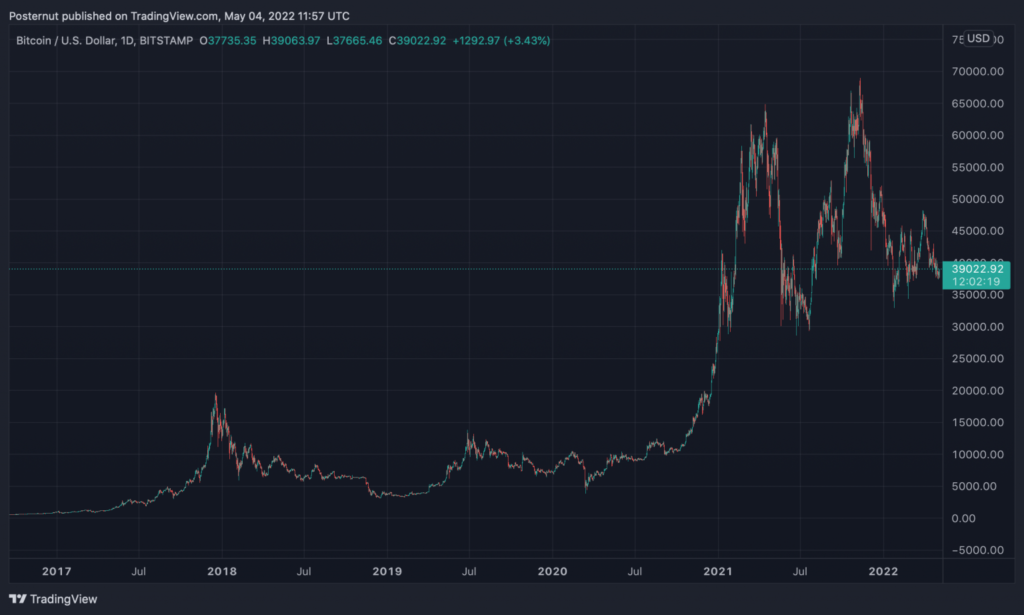
Using today’s bitcoin (BTC) exchange rates against the U.S. dollar indicates that the leading crypto asset has lost 45% so far. Usually, when BTC peaks, the price drops significantly during long-term bearish cycles and after a few specific tops, BTC has dropped more than 80% lower than the high.
For example, in April 2013, BTC reached an all-time high at $259 per unit, but then slipped to $50 per unit, losing around 82.6% in value. From the November 2013 all-time high of $1,163 per unit to January 2016, the value of BTC fell by 86.9%. If bitcoin’s USD value were to lose 80% from the recent high of $69,000 six months ago, the price would fall to a low of $13,800 per unit.
The Softer Bear Market Theory
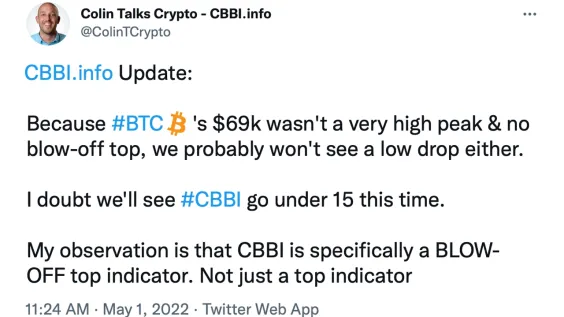
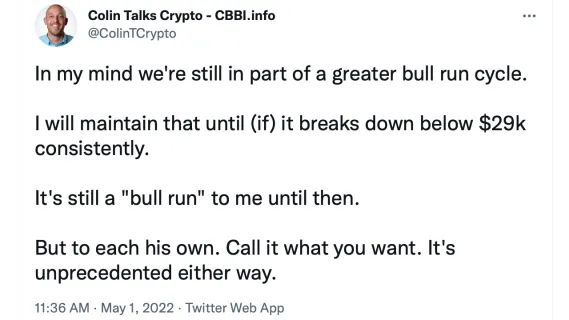
However, there’s a chance that the current bear cycle may be shorter and less impactful this time around. While BTC has seen at least three 80% or more drops, it’s seen a lot more 32-51% drops. One reason bitcoin’s bottom may not be so harsh is because the crypto asset’s peak was not that huge. In fact, the last bitcoin bull run was longer and saw a much smaller percentage gain than previous all-time highs. The crypto advocate and Youtuber ‘Colin Talks Crypto’ discussed the softer bear market theory on May 1.
From the peak of August 17, 2012 ($16) to the peak of April 10, 2013 ($259), BTC gained 1,518.75% between this period. Following this cycle, between the peak of April 10, 2013 and the peak of November 2013, bitcoin gained 349.03%. Then, from the November 2013 peak to the December 2017 peak, BTC jumped 1,590.97%.
This time around, however, the December 2017 peak to the November 2021 top was only 250.85%. It’s been the lowest percentage gain of all the major bull runs in the crypto asset’s lifetime. The lower jump higher could lead to a softer bitcoin bear market that’s much less drastic than an 80% or more plunge.
In addition to the smaller ATH, the preparation for the 2021 ATH was over 400 days. The previous bitcoin bull run (2017) lasted only 200 days, or about half the time. This means that while the weight of the current bear market may be weaker in one direction, it may last much longer than previous bear cycles.